Field Notes
<--2023-01-19 15:55:00 | 2023-02-14 10:05:00-->Other sites visited today: Gilbert Tract | Mayberry | West Pond | East End | Bouldin Corn | Bouldin Alfalfa
Phenocam link: Searching...
Hill Slough: 2023-02-01 16:00:00 (DOY 32)
Author: Daphne Szutu
Others: Robert
Summary: Regular data collection/cleaning, low water level, porewater sample, CTD conductivity ok now
| 2023-02-01 Hill Slough Robert and I arrived at 16:00 PST. It was cold with high thin clouds, hazy horizons, and not too much of a breeze. It was near low tide and the water was just barely covering the ground surface. The staff gauge read 4.1ft at 16:10 PST. The 12”(?) plank in the middle of our platform is starting to crack down the middle. Robert cleaned flux and rad sensors and wiped the staff gauge. The staff gauge needs a scrubby pad to really get it clean, though. I thought we had one in the toolbox but I couldn’t find it today. I collected met, cam, and USB GHG data. We didn’t have any power losses in the last 2 weeks. The wash reservoir as mostly full so we did not refill it. I couldn’t check the live Licor data because I dropped my USB-ethernet dongle in the water at Bouldin Corn. I retrieved it but it's wet so I don't want to plug it into anything just yet. I collected a porewater sample from the sipper at the tower. I’ll bring it back to the lab to store until we can measure it for conductivity. Sample, temperature-compensated conductivity, temperature, notes Porewater, 18.64 mS,, Sample stored in fridge before being measured At the channel, we downloaded miniDOT data and swapped its desiccant. The CTD was missing chunks of its conductivity data in January, but all seems ok now. Probably related to low power from the cloudy weather. We left at 16:30 PST. |
1 photos found

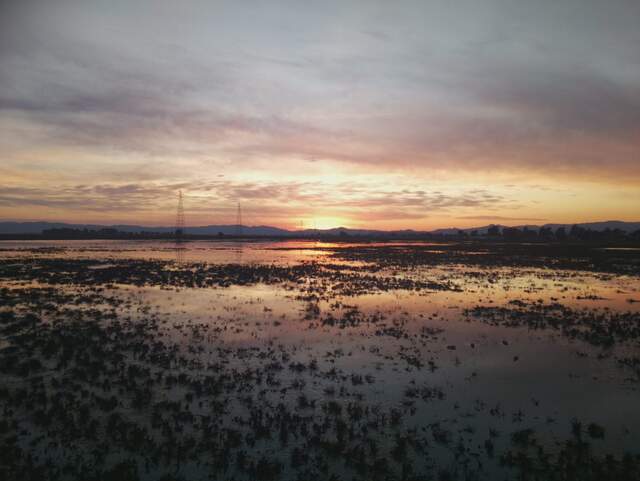
HS_picam_20230201_1745.jpg ( 2023-02-01 17:45:05 ) Full size: 1917x1440
Nice sunset at low tide
4 sets found
21 HS_met graphs found
4 HS_flux graphs found
1 HS_cam graphs found
Can't check HS_Processed
2 HS_Processed graphs found

