Field Notes
<--2022-08-30 09:55:00 | 2022-09-28 10:30:00-->Other sites visited today: Mayberry | West Pond | East End
Phenocam link: Searching...
Gilbert Tract: 2022-09-15 09:25:00 (DOY 258)
Author: Daphne Szutu
Others: Kanishka
Summary: Regular data collection/cleaning, removed Apogee NDVI sensors with end of intercomparison, CA State Parks doing drone surveys, first fall precip in a few days, record-breaking heat wave last week
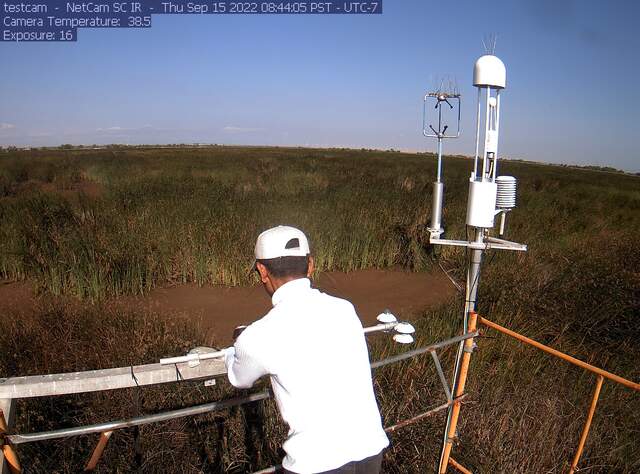
| 2022-09-15 Gilbert Tract Kanishka and I arrived at 9:25 PDT. It was mild and sunny with a cool breeze, with showers expected this coming Sunday. Last week 2022-09-05 to 2022-09-08, most the Bay Area had a record-breaking heat wave with 3 days of all-time high temperatures. Despite the heat, the wetland still looks pretty green. We could hear a drone buzzing about--we later ran into Mike from CA State Parks who explained they were doing a drone survey of the channels. Later in the day they'll move to Emerson parcel and use the drone to spray herbicide for invasive aquatic vegetation. The staff gauge read 73.5cm at 8:58 PST. It was just past high tide I think. At the channel the water looked to be flowing out toward the slough. I downloaded met, cam, and USB GHG data. There were piles of dead ants in the met box and a few live ants. I cleared out the dead ants and left them some more mothballs. Kanishka cleaned rad and flux sensors. We removed the Apogee NDVI sensors sn 1049 and sn 1050 from the tower. The incoming 650in from the SRS NDVI sensor started going bad in mid-May, so we installed the Apogee NDVI sensors for an intercomparison for a month. I uploaded a new CR1000 program that comments out the data table/instructions for the Apogee NDVI sensors. I changed the eddy clock +55sec from 8:42:00 to 8:42:55 and restarted logging. I downloaded the miniDOT data and changed its desiccant. The 7500 read: 393ppm CO2, 675mmol/m3 H2O, 18.7C, 101.5kPa, 105SS – 107 after cleaning The 7700 read: 2.1ppm CH4, 43RSSI – 86 after cleaning We arrived at Flo (the flowmeter) at 10:17 PDT (9:17 PST). I downloaded the data and the last sample time was 9:10 PST, though it should've been 9:15 PST. I reset the clock and declined to calibrate the pressure sensor. I restarted logging and we left the site around 10:30 PDT. |
1 photos found

gilberttract_2022_09_15_084405.jpg ( 2022-09-15 09:48:52 ) Full size: 1296x960
Kanishka cleaning radiometers
8 sets found
Can't check MBWPEESWGT_mixed
Can't check MBEEWPSWEPGT_cam
16 GT_met graphs found
4 GT_flux graphs found
3 GT_adcp graphs found
1 GT_cam graphs found
2 GT_usgs graphs found
No data found for GT_chanexo.

