
Field Notes
<--2022-08-30 13:10:00 | 2022-09-28 13:35:00-->Other sites visited today: Gilbert Tract | Mayberry | East End
Phenocam link: Searching...
West Pond: 2022-09-15 13:00:00 (DOY 258)
Author: Daphne Szutu
Others: Kanishka
Summary: Regular data collection/cleaning, swapped 7500 for calibration, first fall precip expected soon, record-breaking heat wave last week
| 2022-09-15 West Pond Kanishka and I arrived, ate lunch and started tower work around 13:00 PDT. It was mild and sunny with hazy clouds, with showers expected this coming Sunday. Last week 2022-09-05 to 2022-09-08, most the Bay Area had a record-breaking heat wave with 3 days of all-time high temperatures. Not much of a breeze here compared to Dutch Slough and Sherman Island. The water level is still going down, and the staff gauge read 22cm. The plants still look green though. I downloaded met, cam, and USB GHG data. Kanishka cleaned flux and rad sensors. We topped off the wash reservoir. I downloaded the miniDOT data and swapped desiccant for the miniDOT and water level sensors. We also swapped the LI-7500 for calibration: sn 0073 came off and sn 0035 went on. I uploaded a new config file and updated the pressure coefficients. I changed the eddy clock +30 sec from 12:11:20 to 12:11:50. I reset the box and all looks ok. Sn 0073 read: 391ppm CO2, 711mmol/m3 H2O, 24.7C, 101.5kPa, 100SS After cleaning, sn 0073 read: 400ppm CO2, 642mmol/m3 H2O, 14.0C, 101.5kPa, 102SS sn 0035 read: 405 ppm CO2, 606mmol/m3 H2O, 24.9C, 101.5kPA, 99.3SS The 7700 read: 2.0ppm CH4, 47RSSI – 87 after cleaning We left at 13:45 PDT. |
2 photos found

WP_autocam_20220916_1015.jpg ( 2022-09-16 10:15:01 ) Full size: 1920x1440
Mourning dove on boom
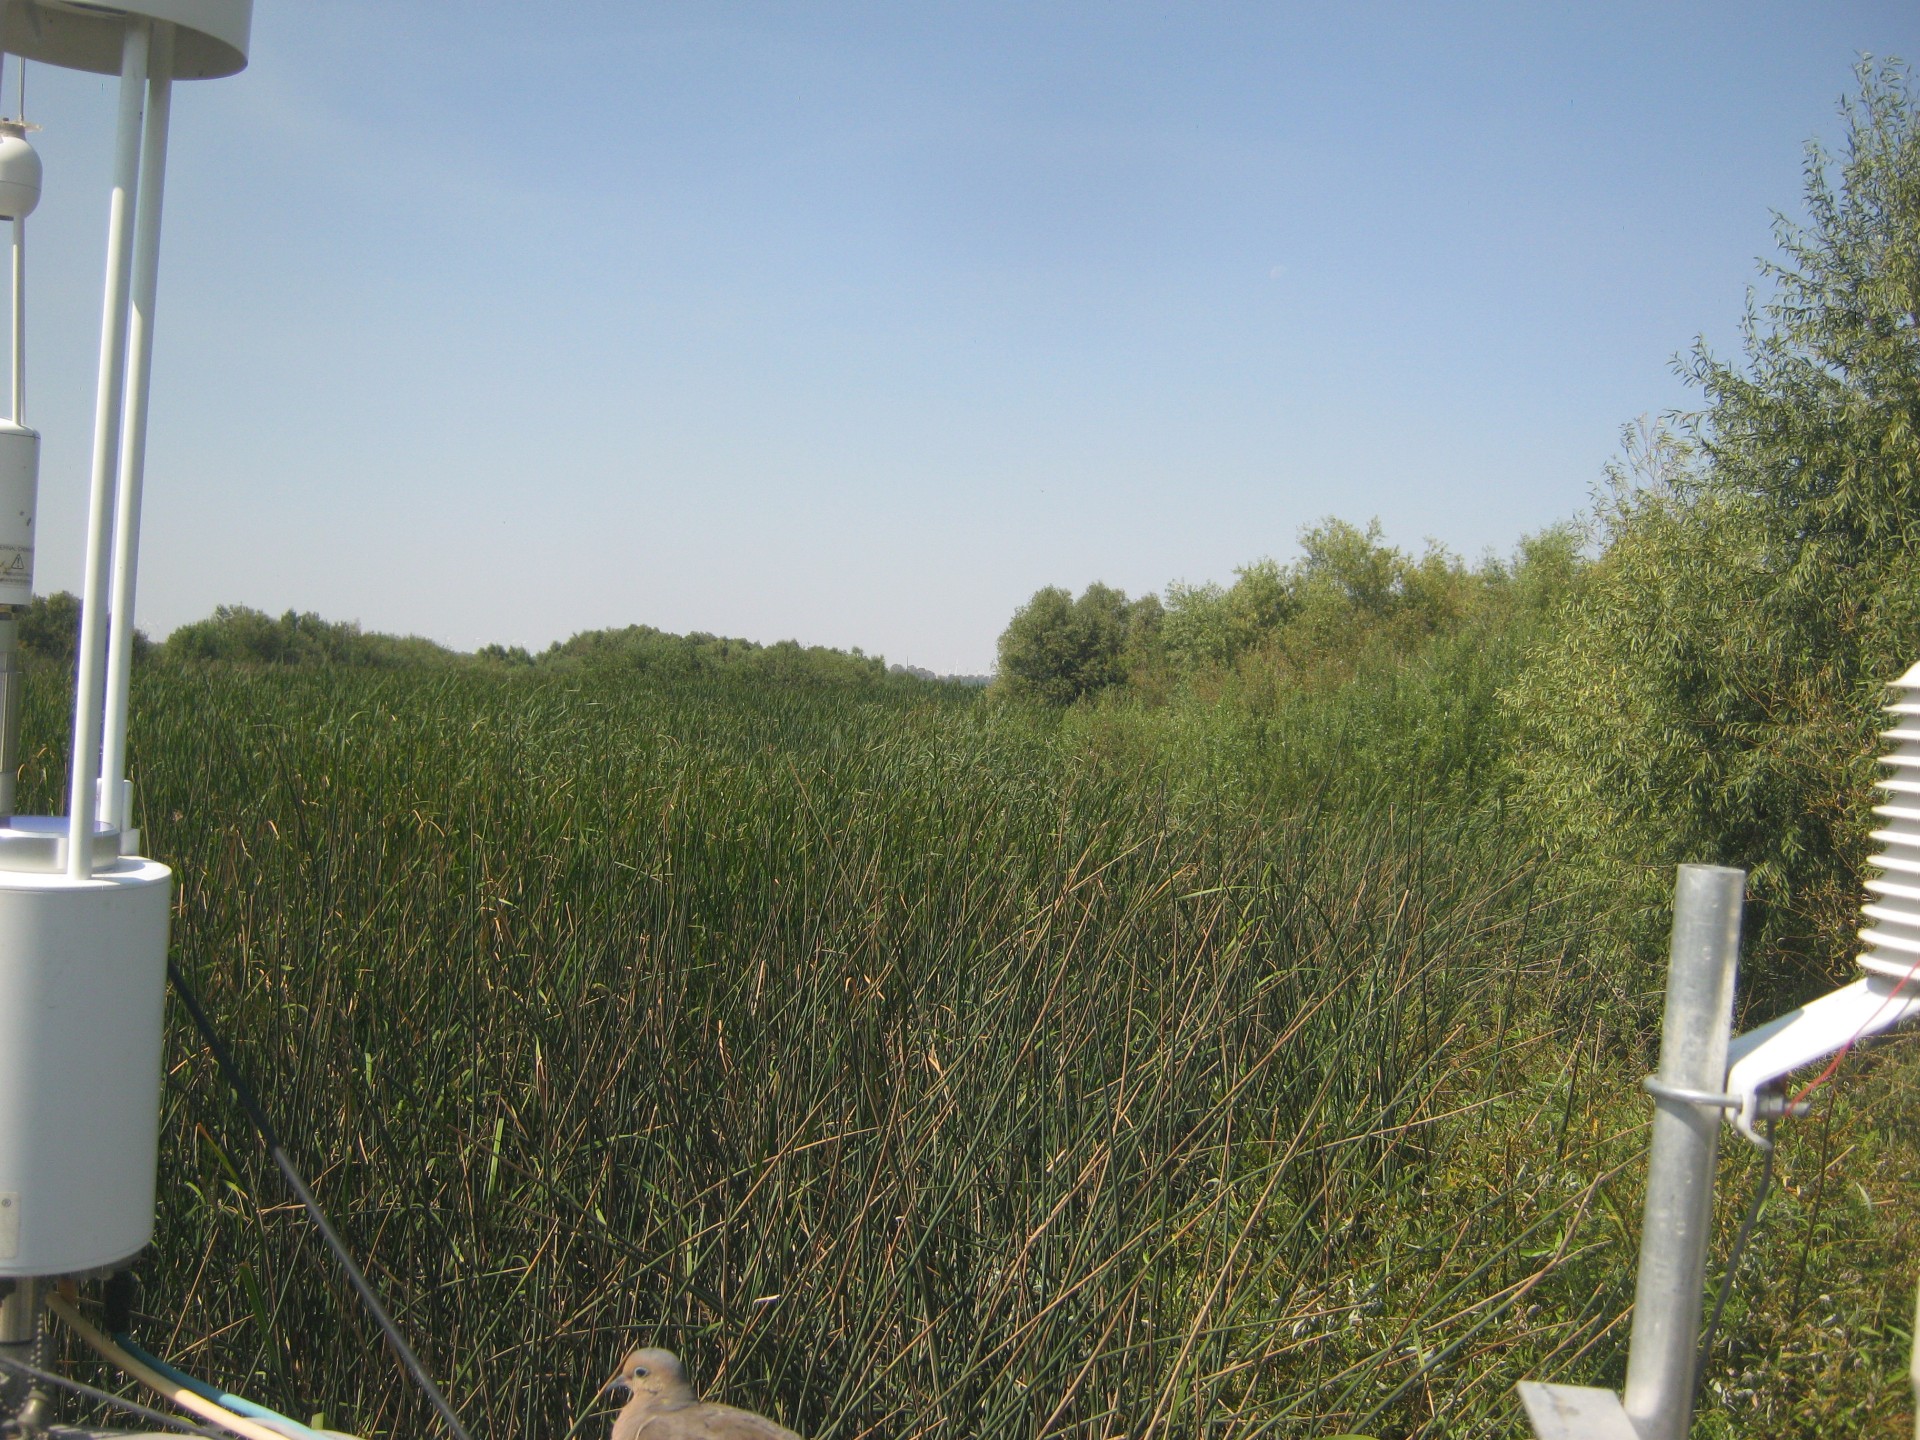
WP_autocam_20220916_1115.jpg ( 2022-09-16 11:15:01 ) Full size: 1920x1440
Mourning dove on boom
8 sets found
Can't check WP_DO
1 WP_DO graphs found
14 WP_met graphs found
5 WP_flux graphs found
Can't check MBWPEESWGT_mixed
Can't check MBEEWPSWEPGT_cam
Can't check MBSWEEWPBCBA
1 WP_processed graphs found
4 WP_arable graphs found