
Field Notes
<--2019-10-17 12:35:00 | 2019-10-31 15:15:00-->Other sites visited today: Bouldin Alfalfa | East End | East Pond | West Pond | Mayberry
Phenocam link: Searching...
Bouldin Corn: 2019-10-22 09:30:00 (DOY 295)
Author: Joe Verfaillie
Others: Daphne
Summary: 7700 calibration and desiccant swap, tipping bucket calibration, cut 1/4 of corn patch.
| Bouldin Corn 2019-10-22 Daphne and I arrived at 9:30. It was mostly clear, sunny and mild with a nice breeze from the northeast. We cut about a quarter of the corn patch nearest the tower while waiting for the 7700 to calibrate. The 7500 read: 440ppm CO2, 524mmol/m3 H2O, 17.1C, 99.7kPa, 99.7SS – 101 after cleaning The 7700 read: 2.78ppm CH4, 54RSSI – 89.5 after cleaning We calibrated the 7700. It took a long time for the readings to settle – I think our flow rates were a little low at first. After calibration we swapped the 7700 desiccant flooding the head with the dry cal gas. The optics RH was 11% afterwards. . The hat and auto-wash spray head were reinstalled. After calibration the 7700 read: 2.59ppm CH4, 87.2RSSI We also calibrated the tipping bucket sn 65548-615. After cleaning the tipping bucket we connected it to a CR23x and dripped 475ml of water through the bucket which should result in 100tips. We got 99 tips – no adjustment needed. We left at 11:00 |
2 photos found
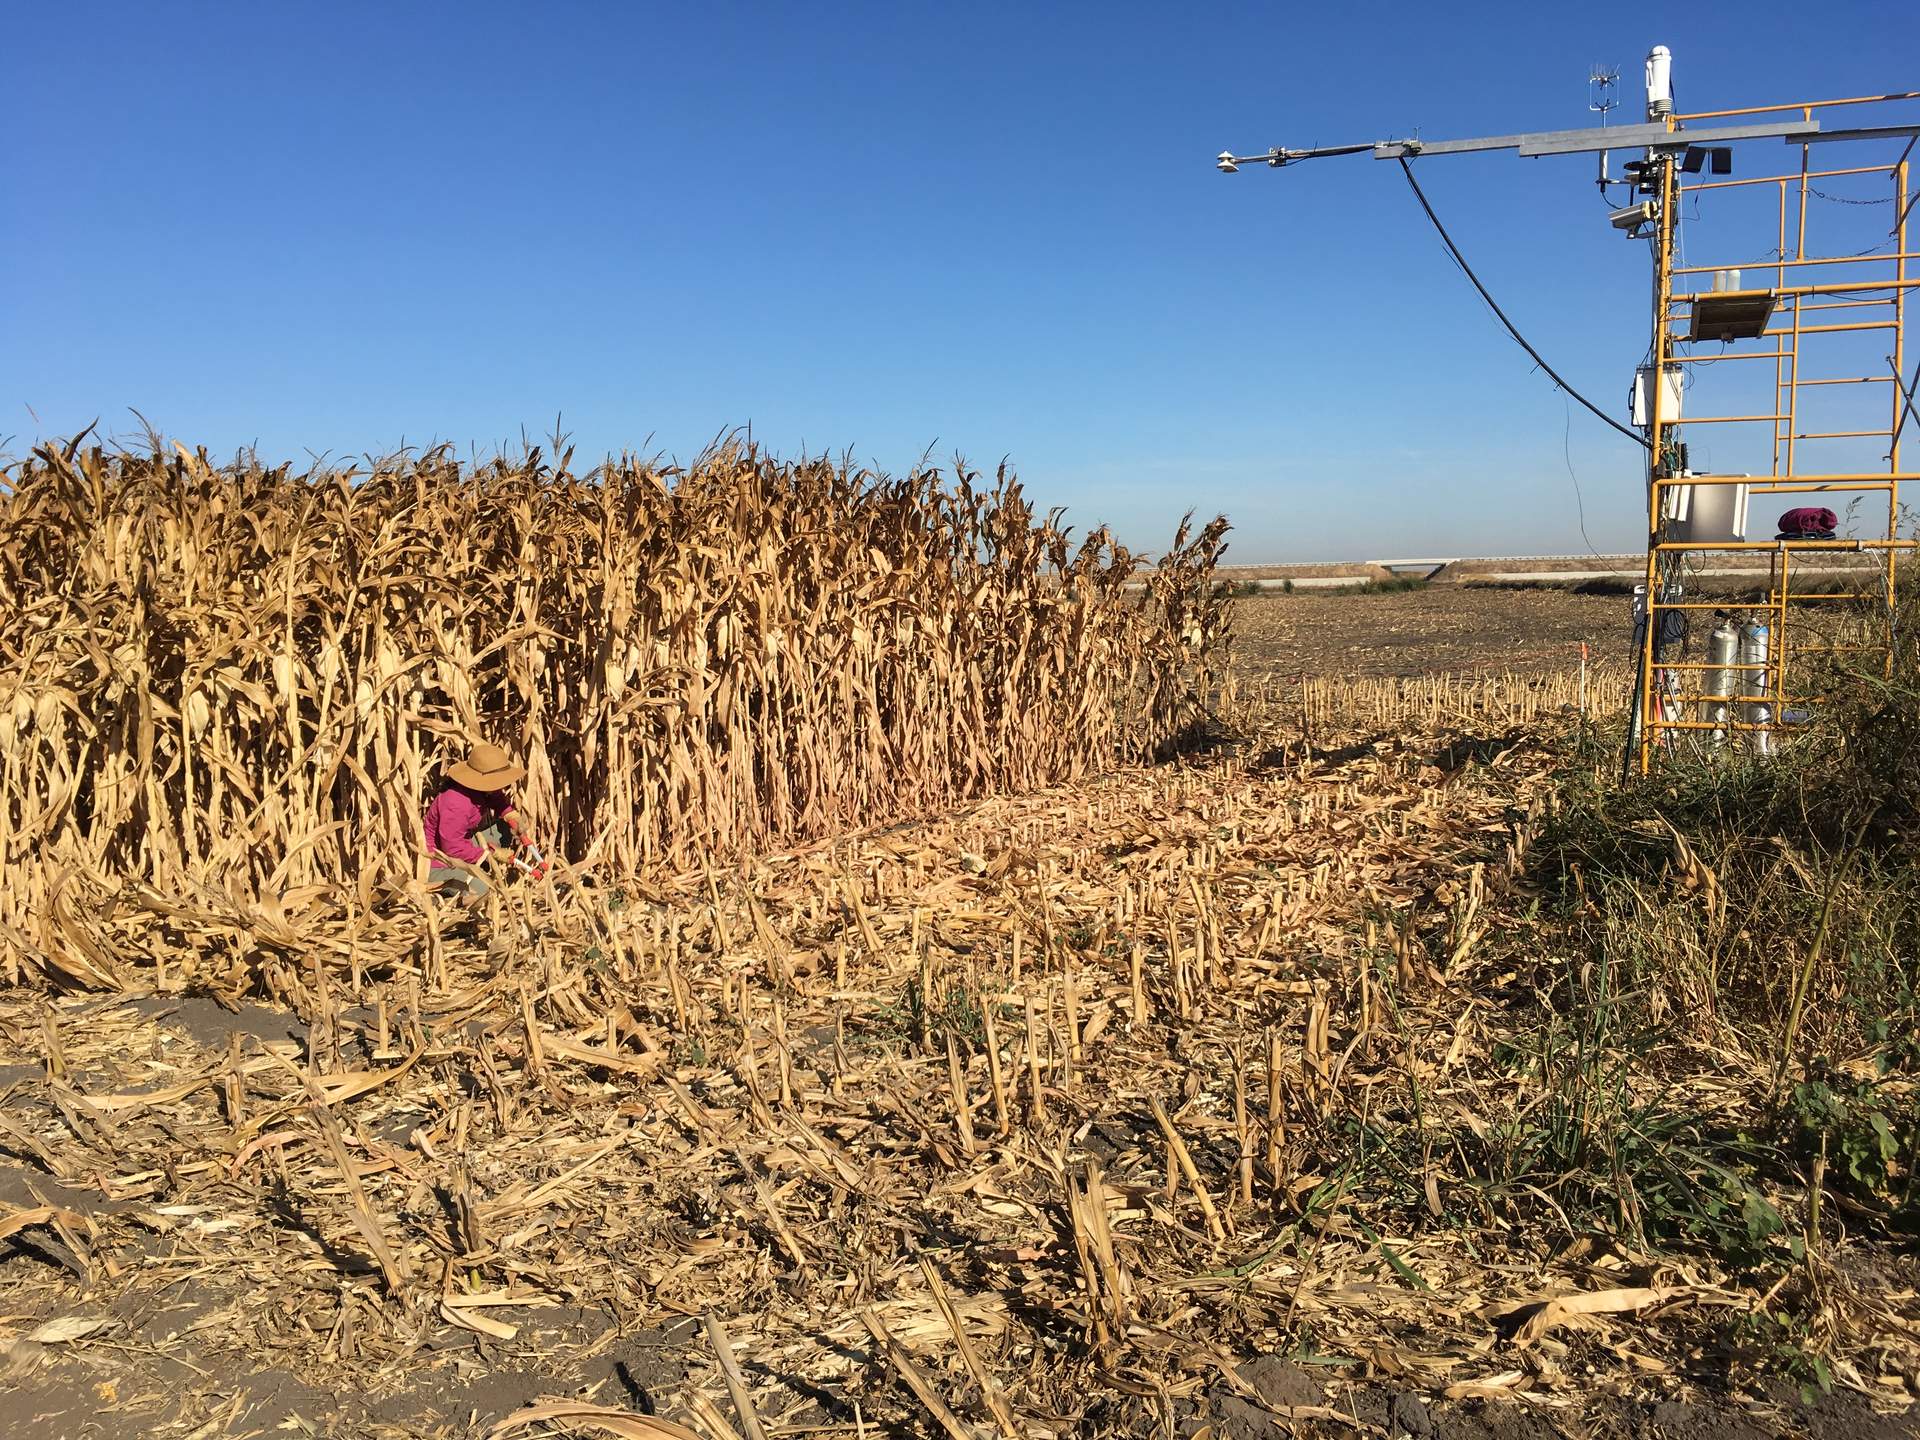
20191022BC_DaphneCuttingCorn.jpg ( 2019-10-22 00:00:00 ) Full size: 1920x1440
Daphne cutting patch of corn left next to tower
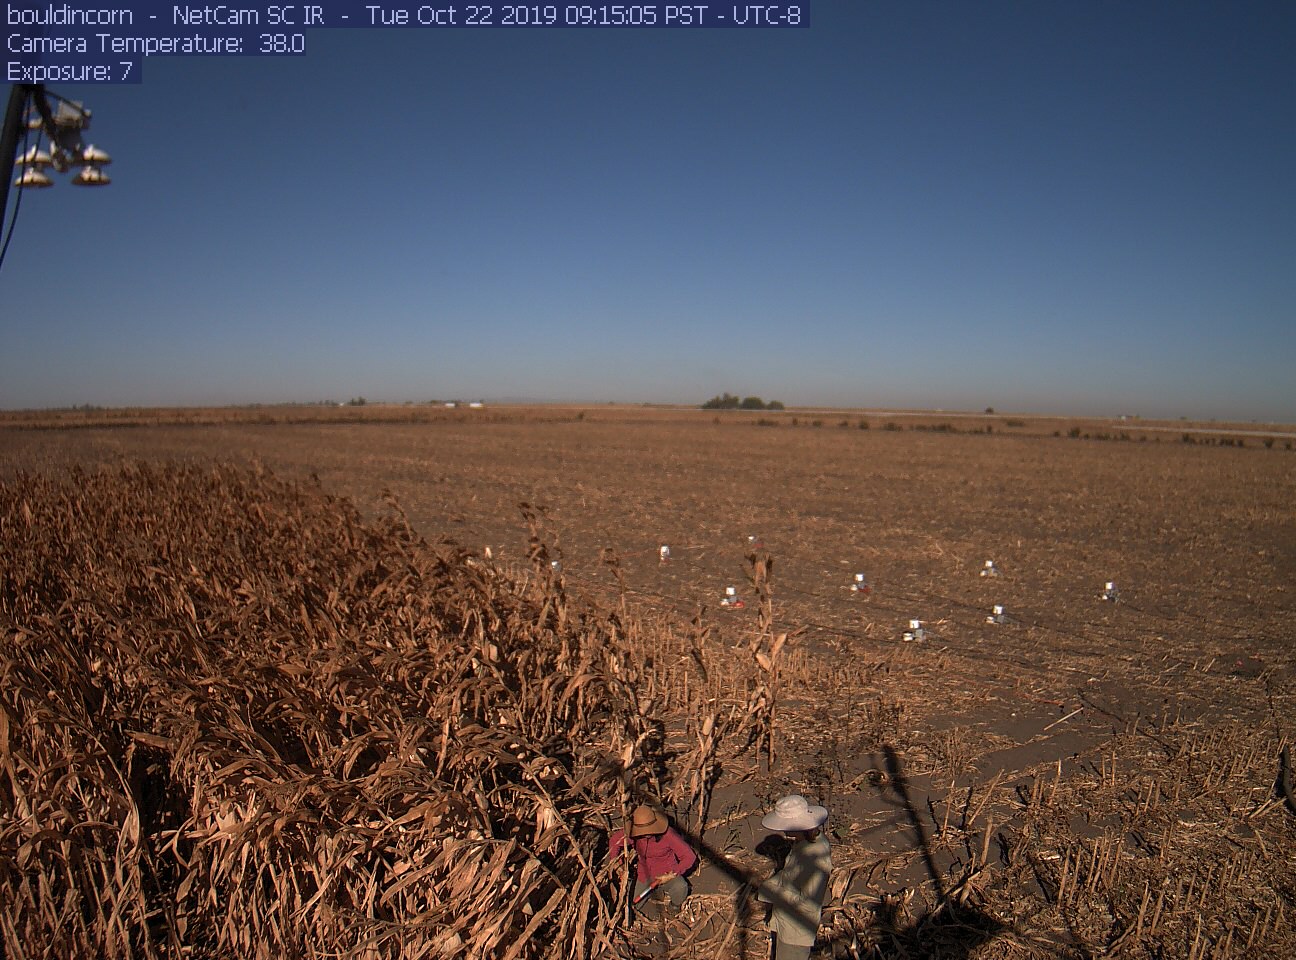
bouldincorn_2019_10_22_091505.jpg ( 2019-10-22 09:31:50 ) Full size: 1296x960
Daphne and Joe on site
6 sets found
17 BC_met graphs found
5 BC_flux graphs found
Can't check TATWBABCSB_cam
Can't check MBSWEEWPBCBA
2 BC_pa graphs found
1 BC_arable graphs found