
Field Notes
<--2019-10-22 09:30:00 | 2019-11-07 09:15:00-->Other sites visited today: Sherman Barn | Sherman Wetland | Mayberry | East End | East Pond | West Pond | Bouldin Alfalfa
Phenocam link: Searching...
Bouldin Corn: 2019-10-31 15:15:00 (DOY 304)
Author: Joe Verfaillie
Others: Camilo
Summary: Wind damage - HMP60 solar shield, diffuse PAR, scaffolding moved slightly.
| Bouldin Corn 2019-10-31 Camilo and I arrived at 15:15. It was clear, sunny and mild with a light north breeze. The corn fields north of the highway were trashed by the heavy wind earlier in the week. The patch of corn near the tower was all blown down. The top boardwalk on the tower was tossed and forcefully unplugged the Purple Air sensor. The HMP60 solar shield was blown away and the rotating shadow band was missing. The scaffolding had also jittered around so it was no longer square and impossible to get the boardwalk to sit in place. We squared up the scaffolding a bit and tried to relevel it. We are planning to move it back away from the field soon so we didn’t put a lot of effort in. But we did make sure its tie downs were tight. I will try to replace the solar shield and the shadow band next week on the way to Tonzi. The 7500 read: 387.3ppm CO2, 436.6mmol/m3 H2O, 22.7C, 101.5kPa, 95.6SS After cleaning: 422ppm CO2, 134mmol/m3 H2O, 102.3SS The 7700 read: 2.7ppm CO2, 3.4RSSI – after cleaning 1.92ppm CH4, 88.0RSSI The USB power connector for the Purple Air was bent but I straightened it and it seemed to work when I plugged it in. Camilo measured the sonic heading at 355 degrees magnetic. Two semi trucks of silage went past while we were there. We left at 15:45 |
1 photos found
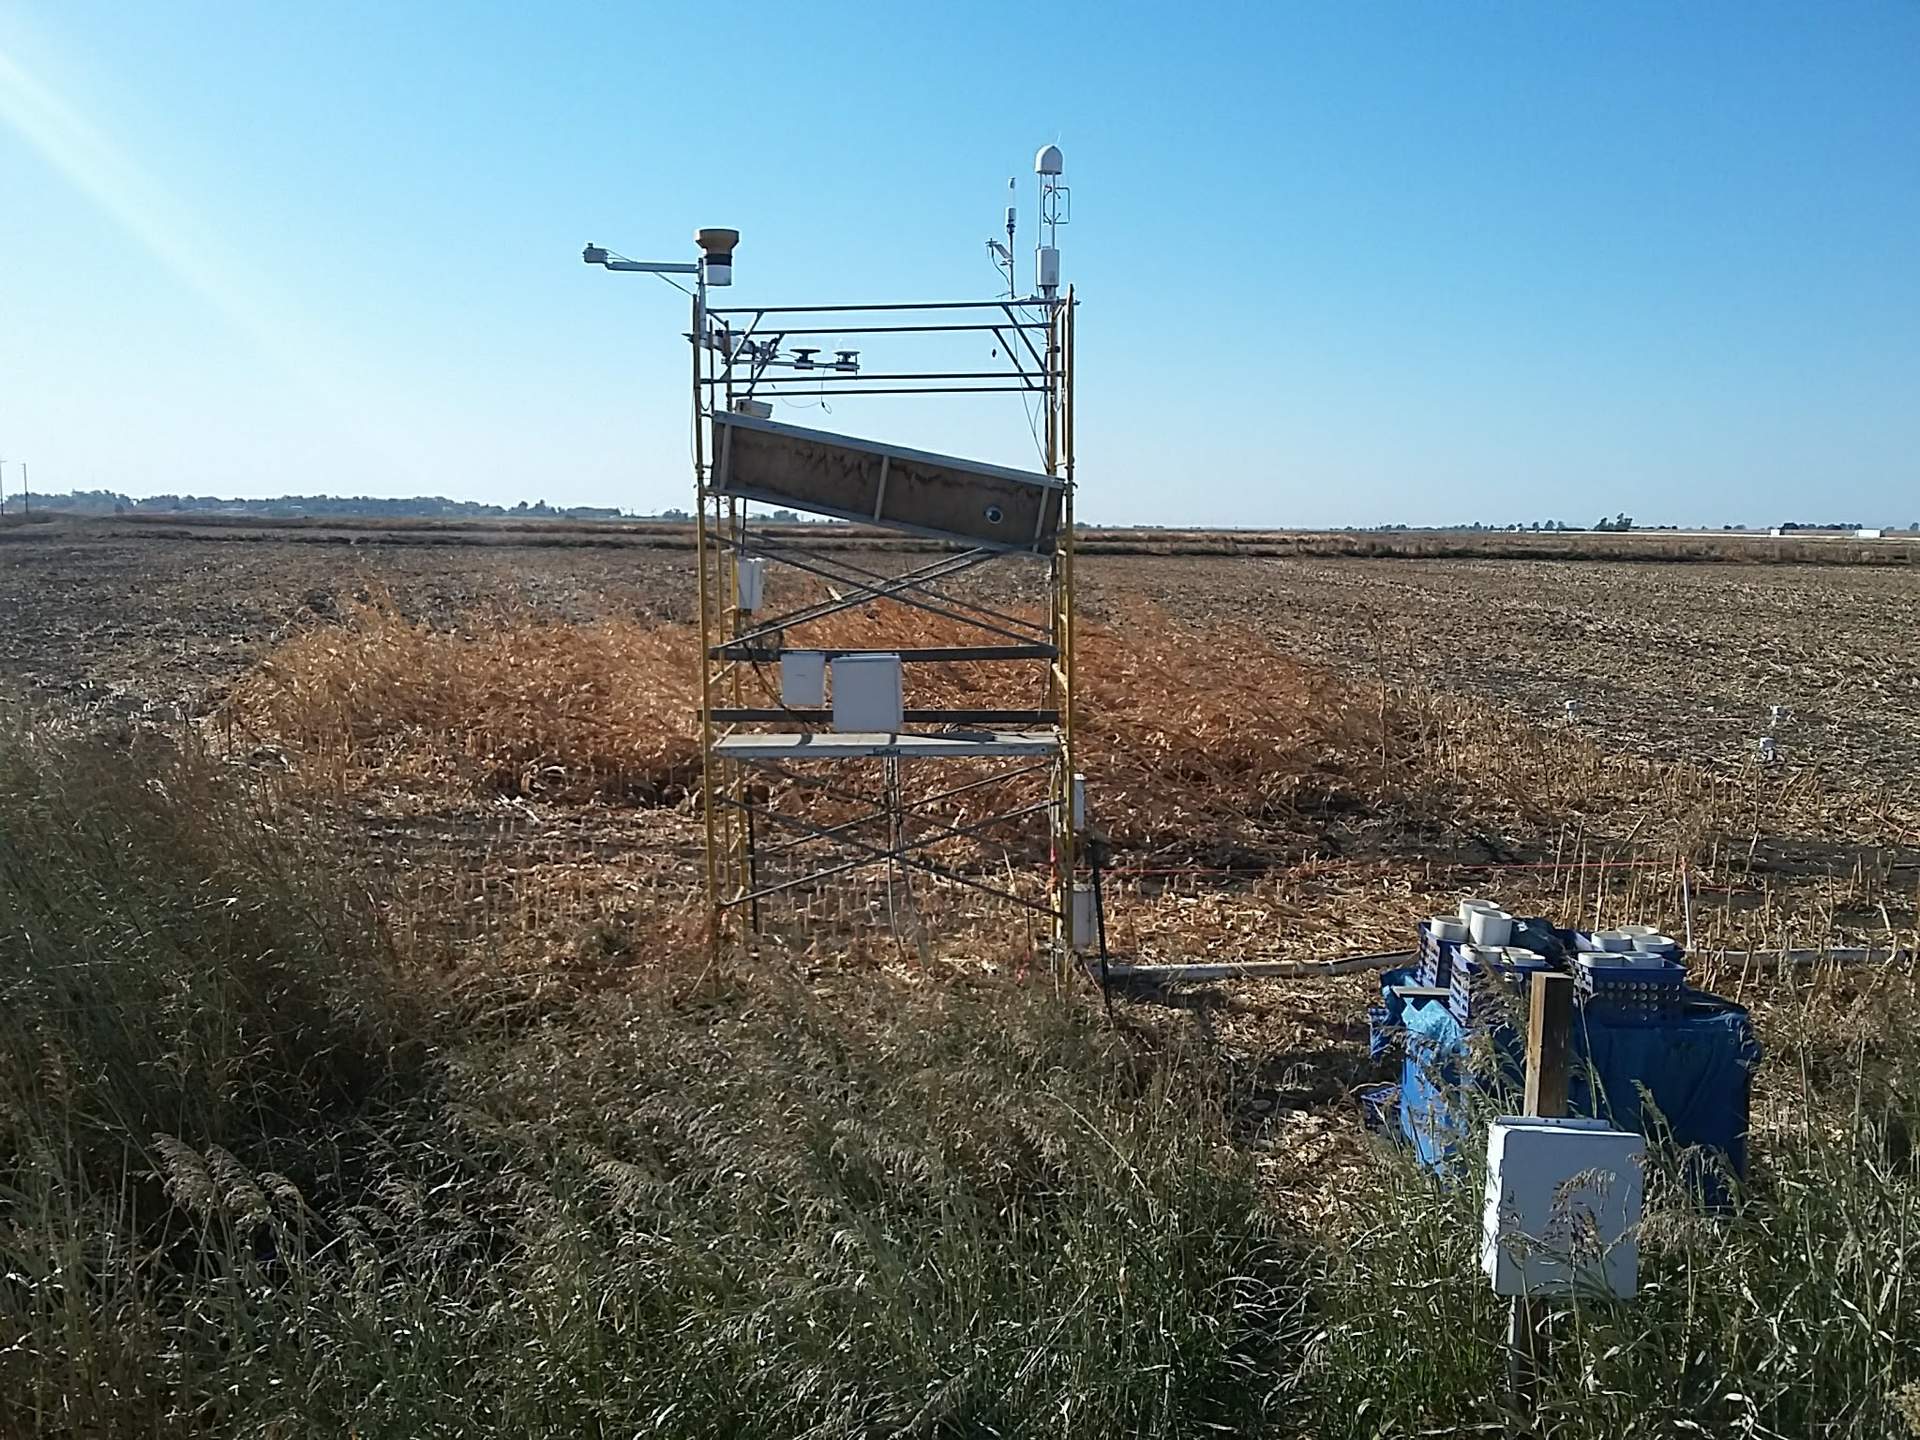
20191031BC_WindDamage.jpg ( 2019-10-31 00:00:00 ) Full size: 1920x1440
The winds blew away the board and the HMP's radiation sensor. Corn
6 sets found
17 BC_met graphs found
5 BC_flux graphs found
Can't check TATWBABCSB_cam
Can't check MBSWEEWPBCBA
2 BC_pa graphs found
1 BC_arable graphs found