
Field Notes
<--2019-05-02 10:20:00 | 2019-06-04 13:35:00-->Other sites visited today: Bouldin Corn | Mayberry | Sherman Barn | East End | East Pond | Sherman Wetland | West Pond
Phenocam link: Searching...
Bouldin Alfalfa: 2019-05-23 08:45:00 (DOY 143)
Author: Joe Verfaillie
Others: Camilo, Robert
Summary: CH4 footprint experiment, Arable Mark II installed. Alfalfa to be mowed soon.
| Bouldin Alfalfa 2019-05-23 I arrived at about 8:45 with Camilo and Robert. It was warm and mostly sunny with a light breeze from the NNW. The alfalfa is knee high and luxurious. Rumor has it that mowing is about two weeks away. The project for today is a release of pure methane as a tracer for footprint analysis. We released nearly pure CH4 from five locations evenly spaced along a 10ft pipe. The pipe was positioned so the outlets were just above the canopy and blew into the wind away from the tower. Three different flow rates were released at 20m and 40m upwind of the tower and two flow rates were released at 60m upwind from the tower. Each released lasted 30min often with a 15min zero period in between. Plumes were easily visible in the CH4 concentration from the LI7700 reaching 6ppm and more. The flow rates, times and distances of the release are provided here in detail: Dist. (m) Time start Time End Flow (ft3/h) Flow (lpm)* 20 10:00 10:30 1.75 1.49 20 10:45 11:15 3.5 2.99 20 11:30 12:00 10 8.54 40 12:15 12:45 8.25 7.05 40 13:00 13:30 5 4.27 40 13:45 14:15 1.75 1.49 60 14:30 15:00 8 6.83 60 15:00 15:30 1.75 1.49 * This is the corrected flow given the ratio of methane to air molecular mass (28.97/16) I mounted a new Arable Mark II device sn C002469 on the southeast facing side of the scaffolding. I moved the Mark I sn A001311 that Loreli installed on 4-25 from the southwest facing railing near the eddy sensors to the southeast railing with the other two Arable devices. The southwest railing is mounted on pins and not stable whereas the southeast railing is a solid part of the scaffolding. Eventually, I think I will move our old Mark I to another site – no need for three on them at one site. Robert took clip plots. Robert and I puzzled through the LAI-2200 instructions and got a preliminary LAI of about 5. Robert and I went to the Corn site around 11:30 while Camilo continued the CH4 release experiment. We returned about 1pm and I did spectral measurements with the old Ocean Optics USB spectrometer. About 15:30 the CH4 release experiment was over and I collected the data: met, flux, camera. I did not have the software for the FD chamber but it seemed to be running – buzzing in the appropriate pattern. I did not write down the LI7500 or LI7700 numbers but they looked good. The 7700 RSSI was about 30 when we arrived and it did an auto wash soon after we got there. I cleaned the eddy sensors and the 7700 RSSI was about 80 for the CH4 release experiment. I poured half a gallon of DI into the wash reservoir and did not quite fill it. I missed getting a week of 5min met data that was missing from last time. We need data from 4-25 to 5-2. |
Next Mowing: 2019-06-08
2 photos found
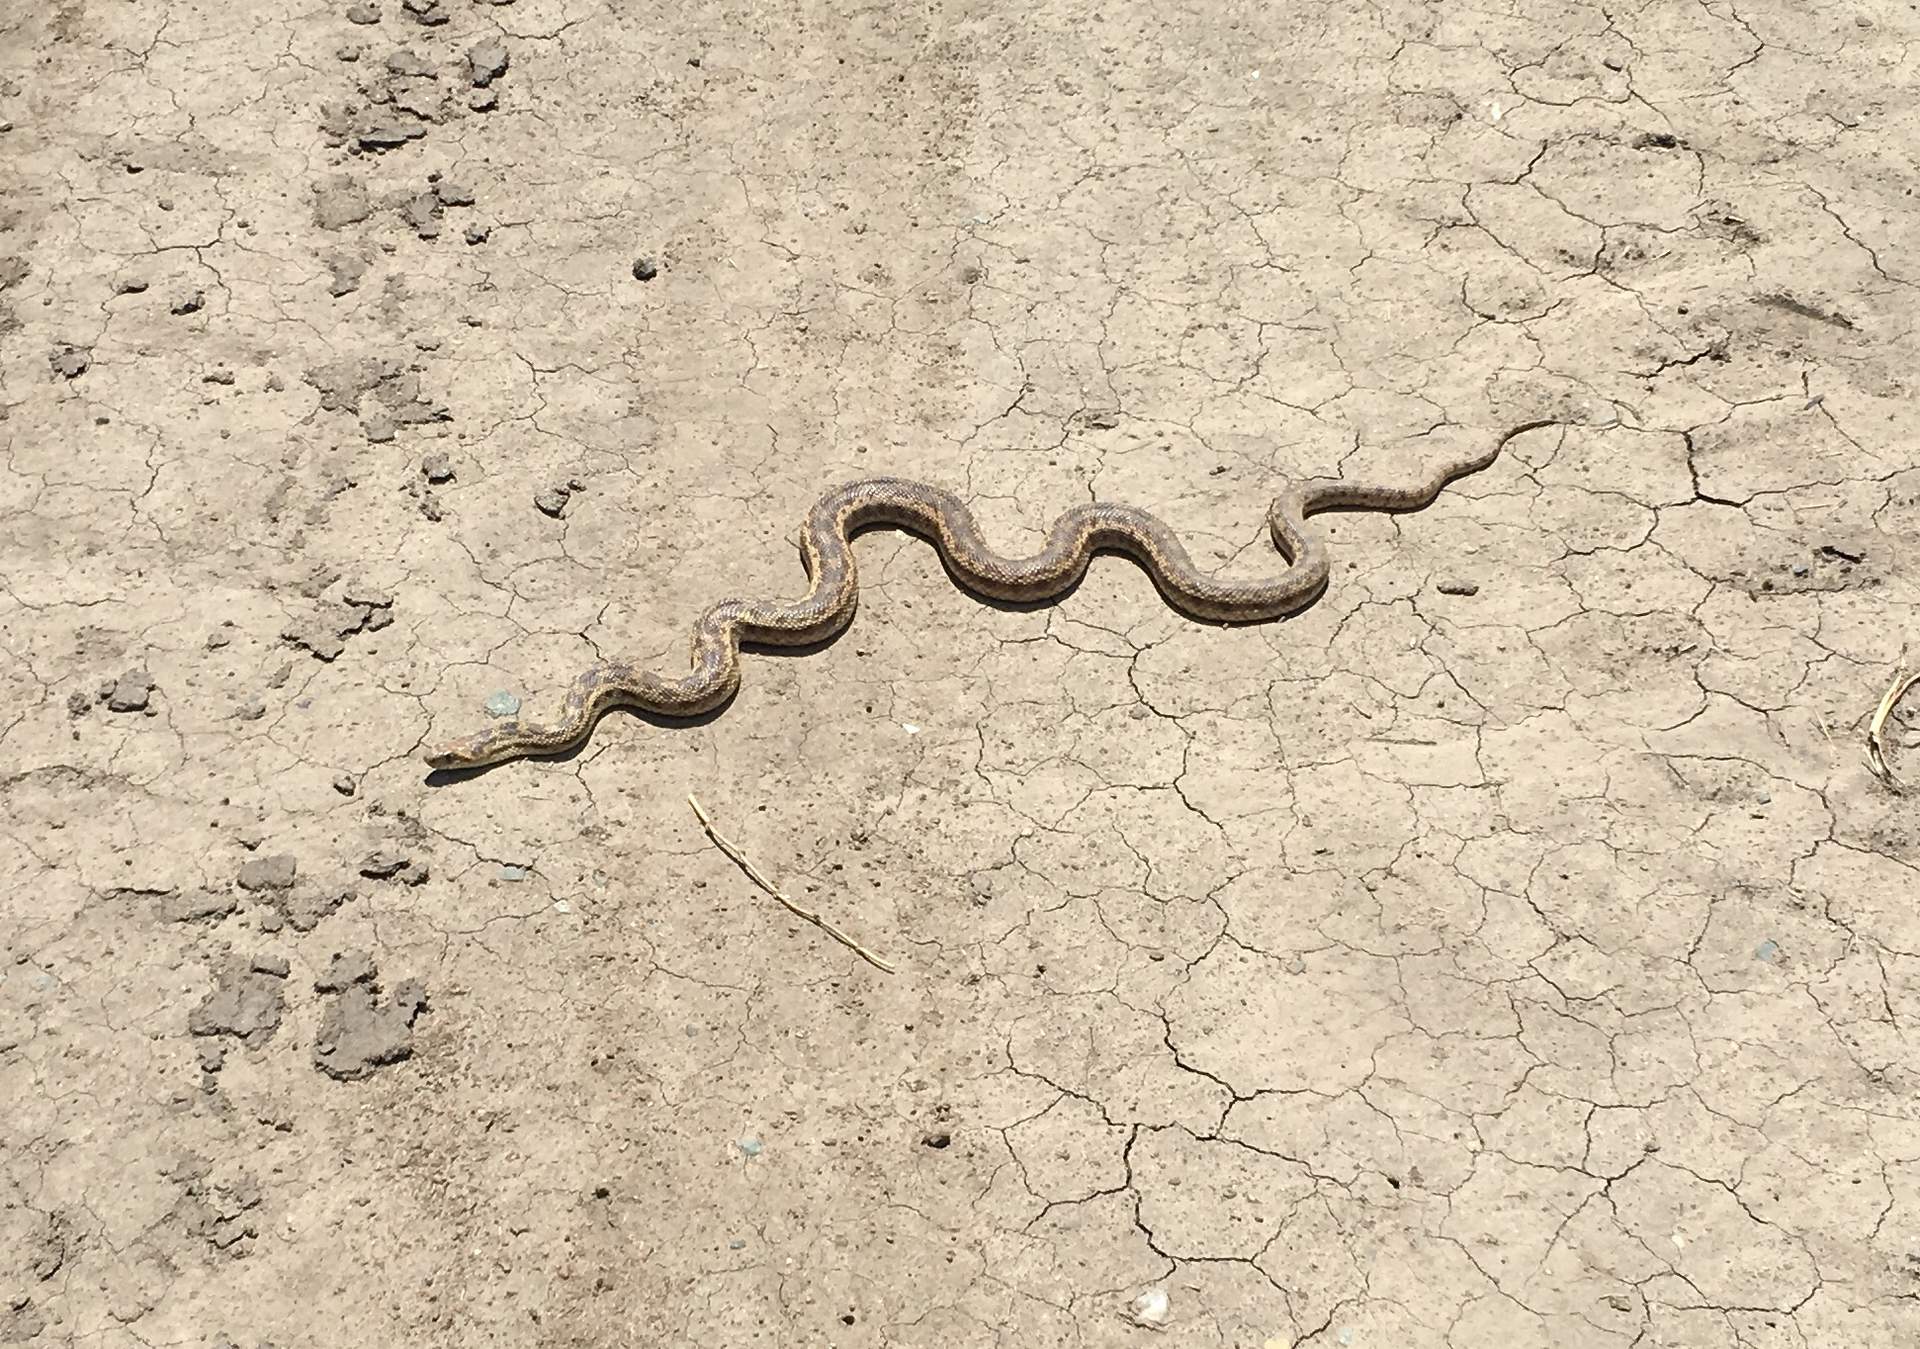
20190523BA_GopherSnake.jpg ( 2019-05-23 00:00:00 ) Full size: 1920x1349
Why does the gopher snake cross the road
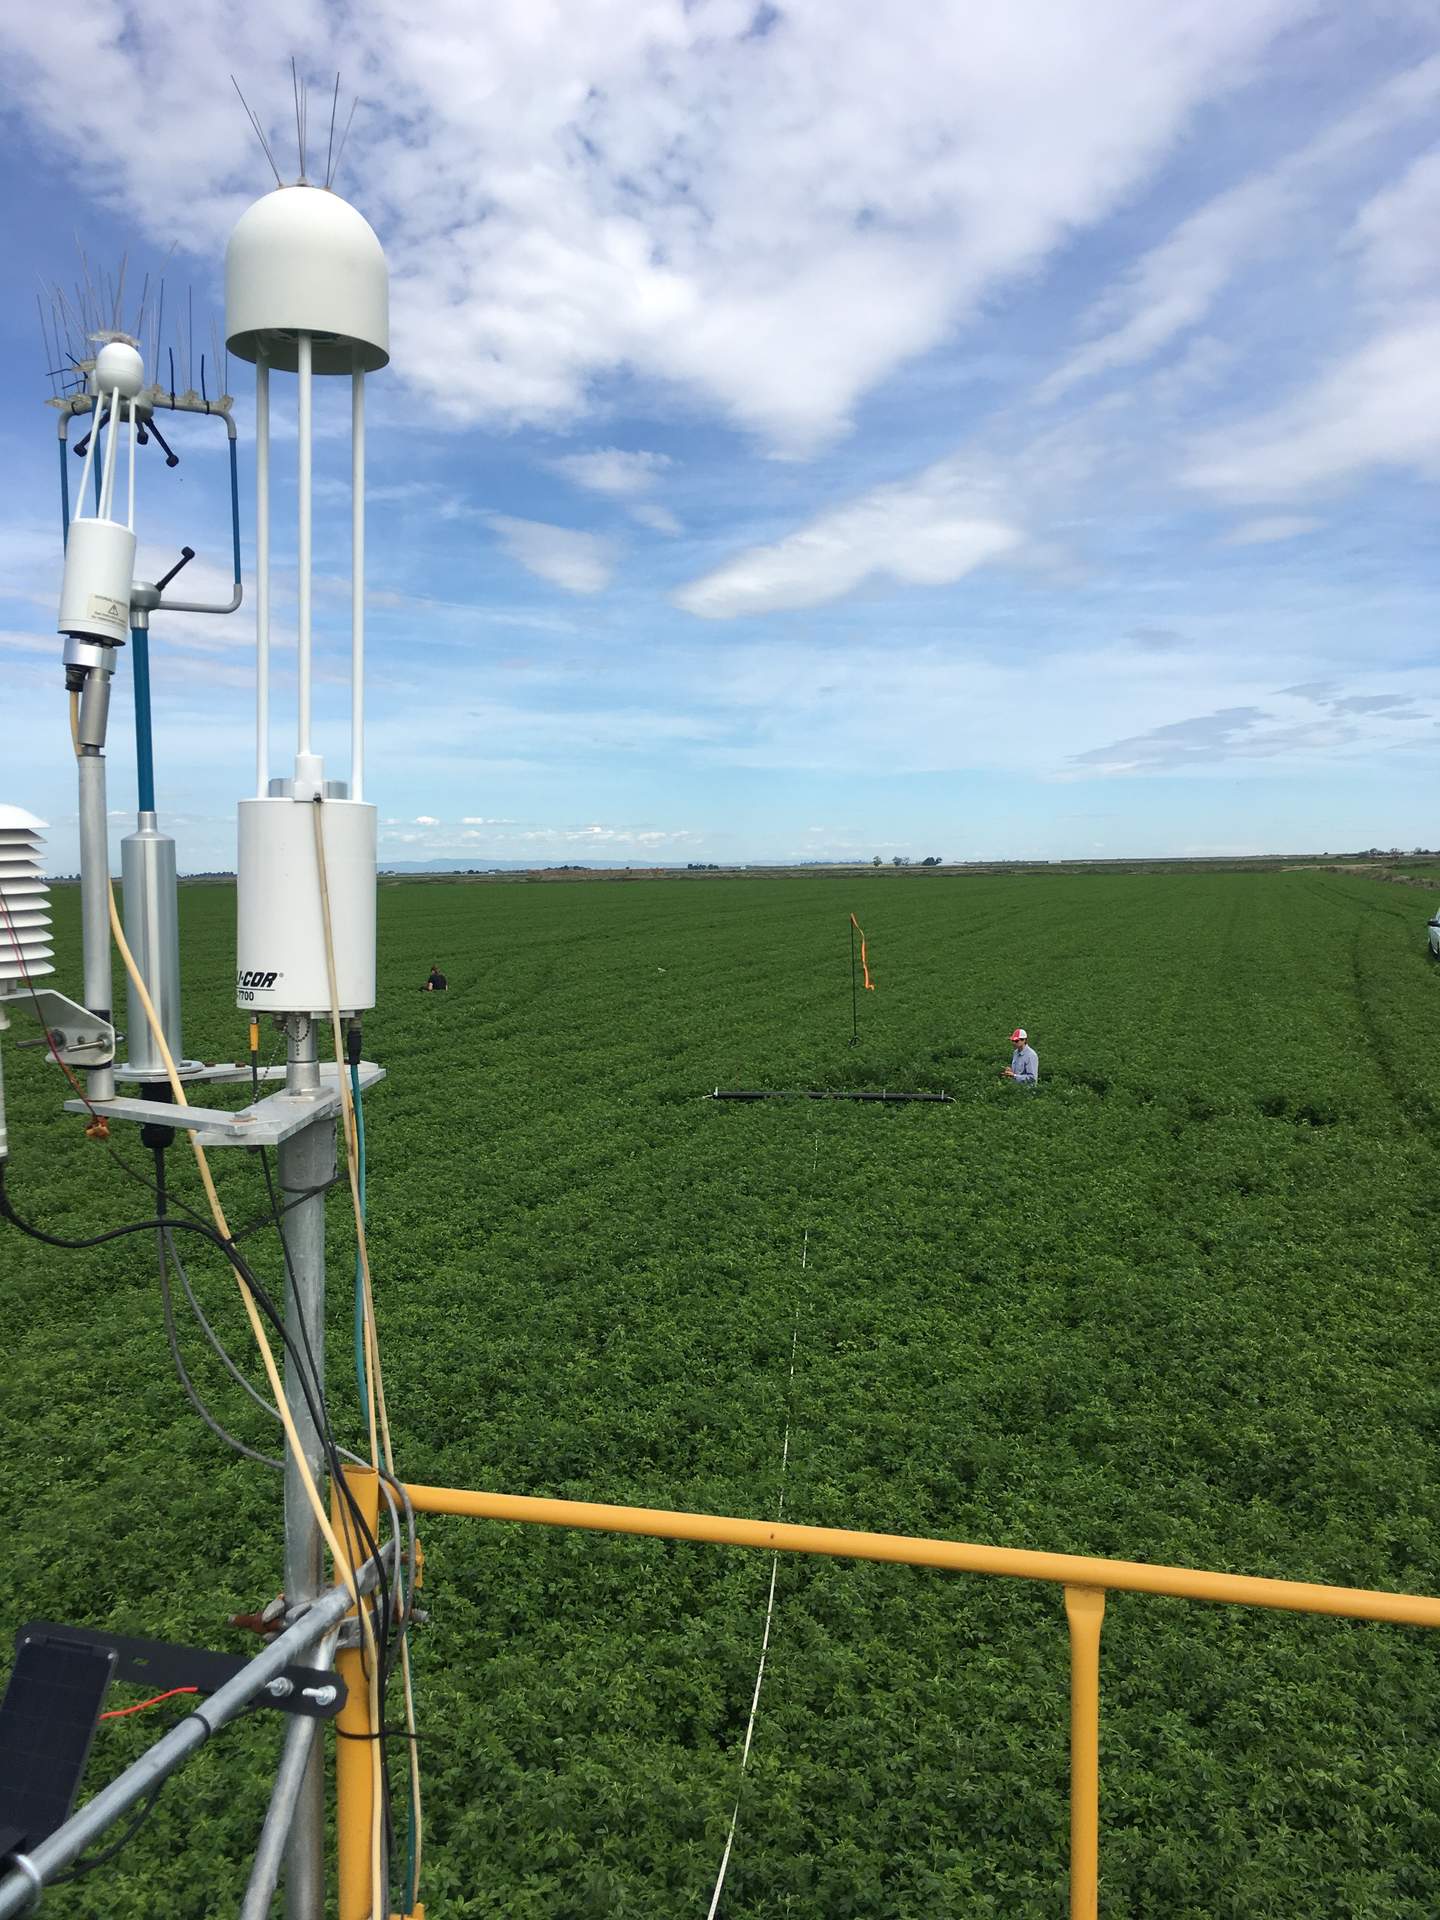
20190523BA_MethaneRelease.jpg ( 2019-05-23 00:00:00 ) Full size: 1440x1920
Camilo releasing CH4 for footprint experiment
7 sets found
5 BA_flux graphs found
21 BA_met graphs found
6 BA_arable graphs found
Can't check TATWBABCSB_cam
Can't check MBSWEEWPBCBA
2 BA_processed graphs found
No data found for BA_adex.