Field Notes
<--2014-10-30 12:50:00 | 2014-11-25 15:30:00-->Other sites visited today: Sherman Island | Mayberry | Twitchell Rice | East End | West Pond
Phenocam link: Searching...
Twitchell Alfalfa: 2014-11-11 11:05:00 (DOY 315)
Author: Cove Sturtevant
Others: Joe, Sara, Hisashi, Pascal, Sam
Summary: Collected data. Minor maintenance. Regular fieldwork. Fixed SHF #2.
| Twitchell Alfalfa 2014-11-11 We arrived at about 11:05 PST. It was overcast, windy, and cool. I checked the tower and downloaded data while Joe did maintenance on the soil CO2 system, he replaced the ad-hoc 10kohm voltage dividers with 499kohm dividers. Sara did spectral and soil respiration, Sam and Pascal did veg height. Hisashi made 0-second videos complete with soundtrack. 7500 readings: CO2 = 312 ppm (402 after cleaning) – TONS OF SPIDER WEBS H2O = 813 mmol m-3 (540 after cleaning) signal strength = 69.48% (84.89% after cleaning) p = 101.2 kPa t = 18.2 C sos = 345.4 m s-1 SHF #2 was NaN, found the wire chewed by squirrels. Fixed. Rad good. Soil respiration notes: #1: 1.1 umol m-2 s-1 #2: 2.7 umol m-2 s-1 (after #2, set target to 380 ppm since ambient was reading 370) #3: 0.9 umol m-2 s-1 (only 2 reps, stopped rep #3 – 1 empty file) #4: 4.3 umol m-2 s-1 (#’s 4-6 dCO2 = 5ppm, 2 cycles only to speed things up) #5: 1.8 umol m-2 s-1 #6: 2.8 umol m-2 s-1 |
Veg Height (cm): Tape measure from ground to top of plant
26, 12, 20, 10, 15, 9, 15, 19, 15, 18, 20, 11, 13, 15, 19, 8, 22, 15, 7, 12, avg = 15.1, stdev = 4.99
2 photos found

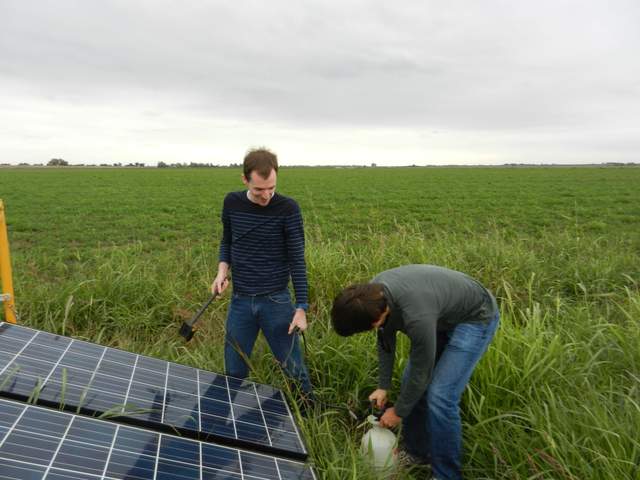
20141111TA_SamPascal.jpg ( 2014-11-11 12:22:03 ) Full size: 1920x1440
Sam and Pascal cleaning solar panels at Aflalfa

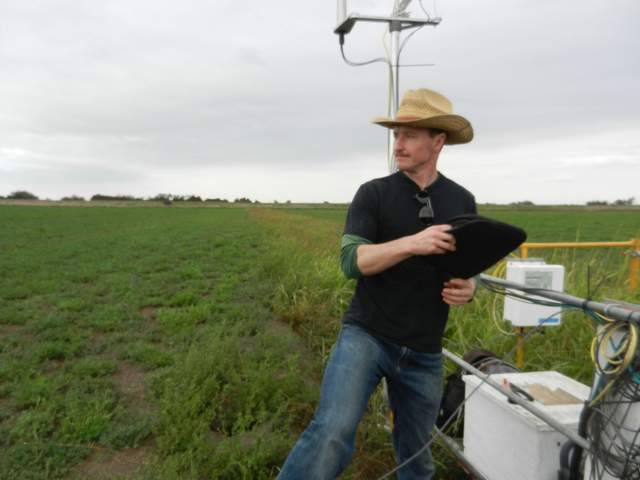
20141111TA_Cove1.jpg ( 2014-11-11 12:21:44 ) Full size: 1920x1440
Cowboy Cove at Alfalfa
7 sets found
Can't check TA_met
11 TA_met graphs found
Can't check TA_rad
3 TA_rad graphs found
Can't check TA_flux
5 TA_flux graphs found
Can't check TA_soilco2
7 TA_soilco2 graphs found
No data found for TA_arable.
1 TA_cam graphs found
Can't check TATWBABCSB_cam

