Field Notes

<--2014-09-25 11:00:00 | 2014-10-09 14:00:00-->
Other sites visited today: Sherman Island | Twitchell Rice | East End | West Pond | Twitchell Alfalfa | Tonzi
Phenocam link: Searching...

Mayberry: 2014-10-02 14:30:00 (DOY 275)
Author: Cove Sturtevant
Others: Sara

Summary: Water level high at high veg and permanent tower. Lots of caterpillars at high veg. Dusty. Data download. 7500 firmware update.

Mayberry
2014-10-02

Portable Tower
We arrived at the high veg portable tower site at about 14:30 PDT. It was hot and sunny. Lots of wasps buzzing about. The water level was very high here. Tons of caterpillars about. There was a big dirt truck driving on the main N-S berm and making everything really dusty. I think it was filling potholes in the berm. Sara took water samples while I checked the tower and downloaded data. I also updated the 7500 firmware to 7.3.0.

Readings
CO2: 399 ppm (414after cleaning)
H2O: 300 mmol m-3 (355 after cleaning)
signal strength = 72.48% (78.15% after cleaning)
p = 101.6 kPa
t: 32.8 °C
sos = 350.9 m s-1
CH4: 2.03 ppm (after cleaning)
RSSI: 2% (71% after cleaning). Also checked that sprayer and spinner worked.
Topped off reservoir.

Didn’t check Met.

Permanent Tower
We arrived about 15:00 PDT. Hot and sunny. Water level high. Sara took water samples and cleaned the radiometers while I checked the tower, updated the 7500 firmware to 7.3.0, and downloaded data. I also cleaned the Ameriflux sensors since the dirt truck was making things dusty.

Readings
CO2: 400 ppm (409 after cleaning)
H2O: 480 mmol m-3 (401 after cleaning)
signal strength = 98.79% (100.27% after cleaning)
p = 101.6 kPa
t: 30.7 °C
sos = 351.1 m s-1
CH4: 2.0 ppm
RSSI: 56% (70% after cleaning)

Met looked good.

2 photos found

Heron and Ameriflux equipment
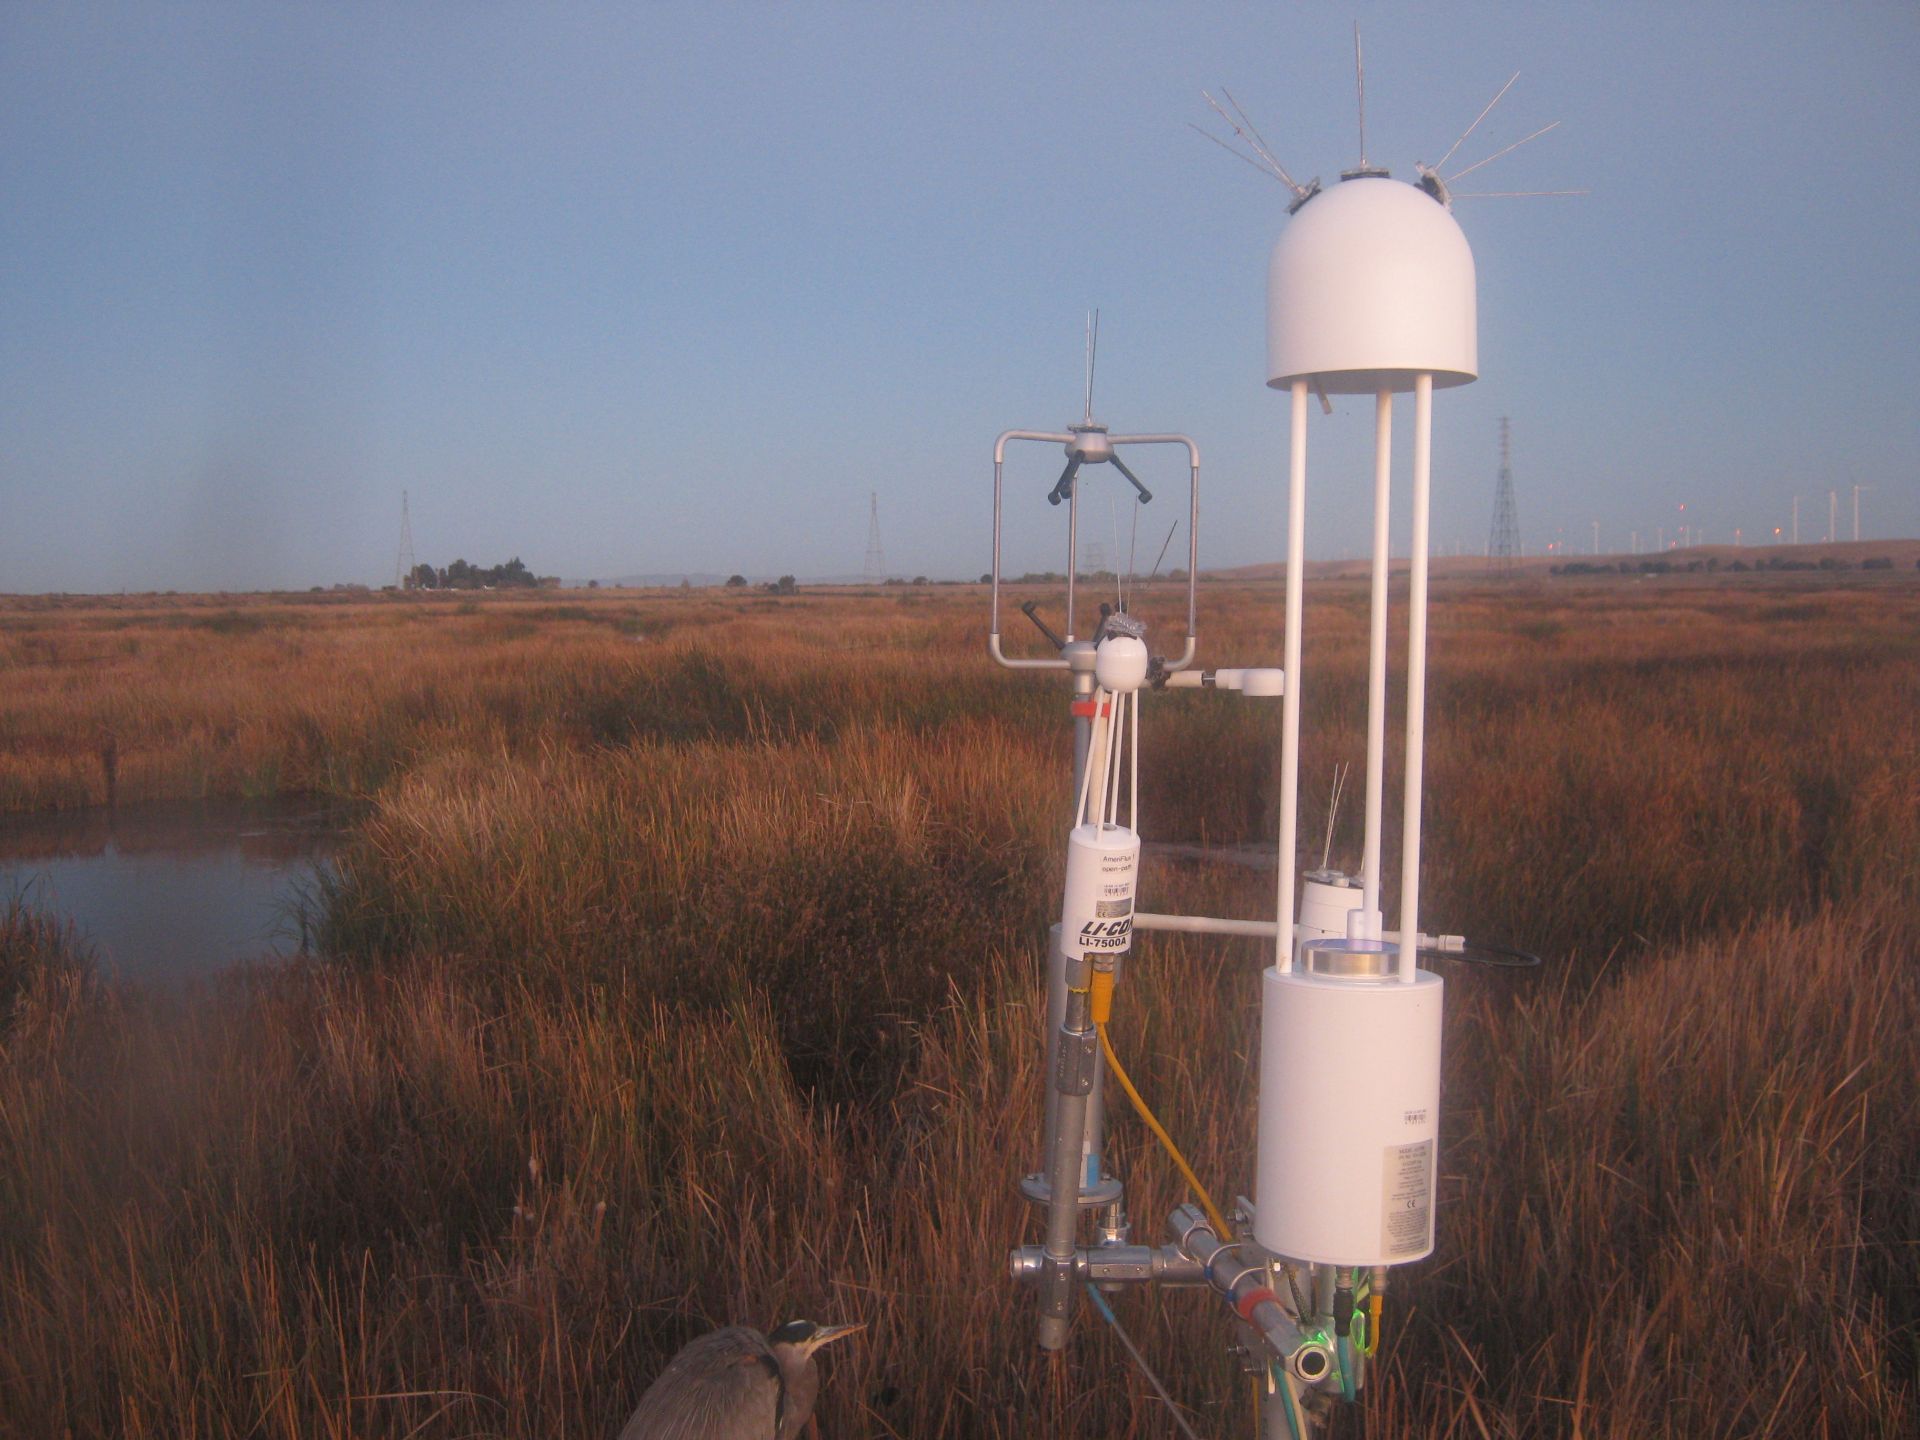
MB_autocam_20141002_0645.jpg ( 2014-10-02 06:45:02 ) Full size: 1920x1440
Heron and Ameriflux equipment

Ameriflux equipment being removed
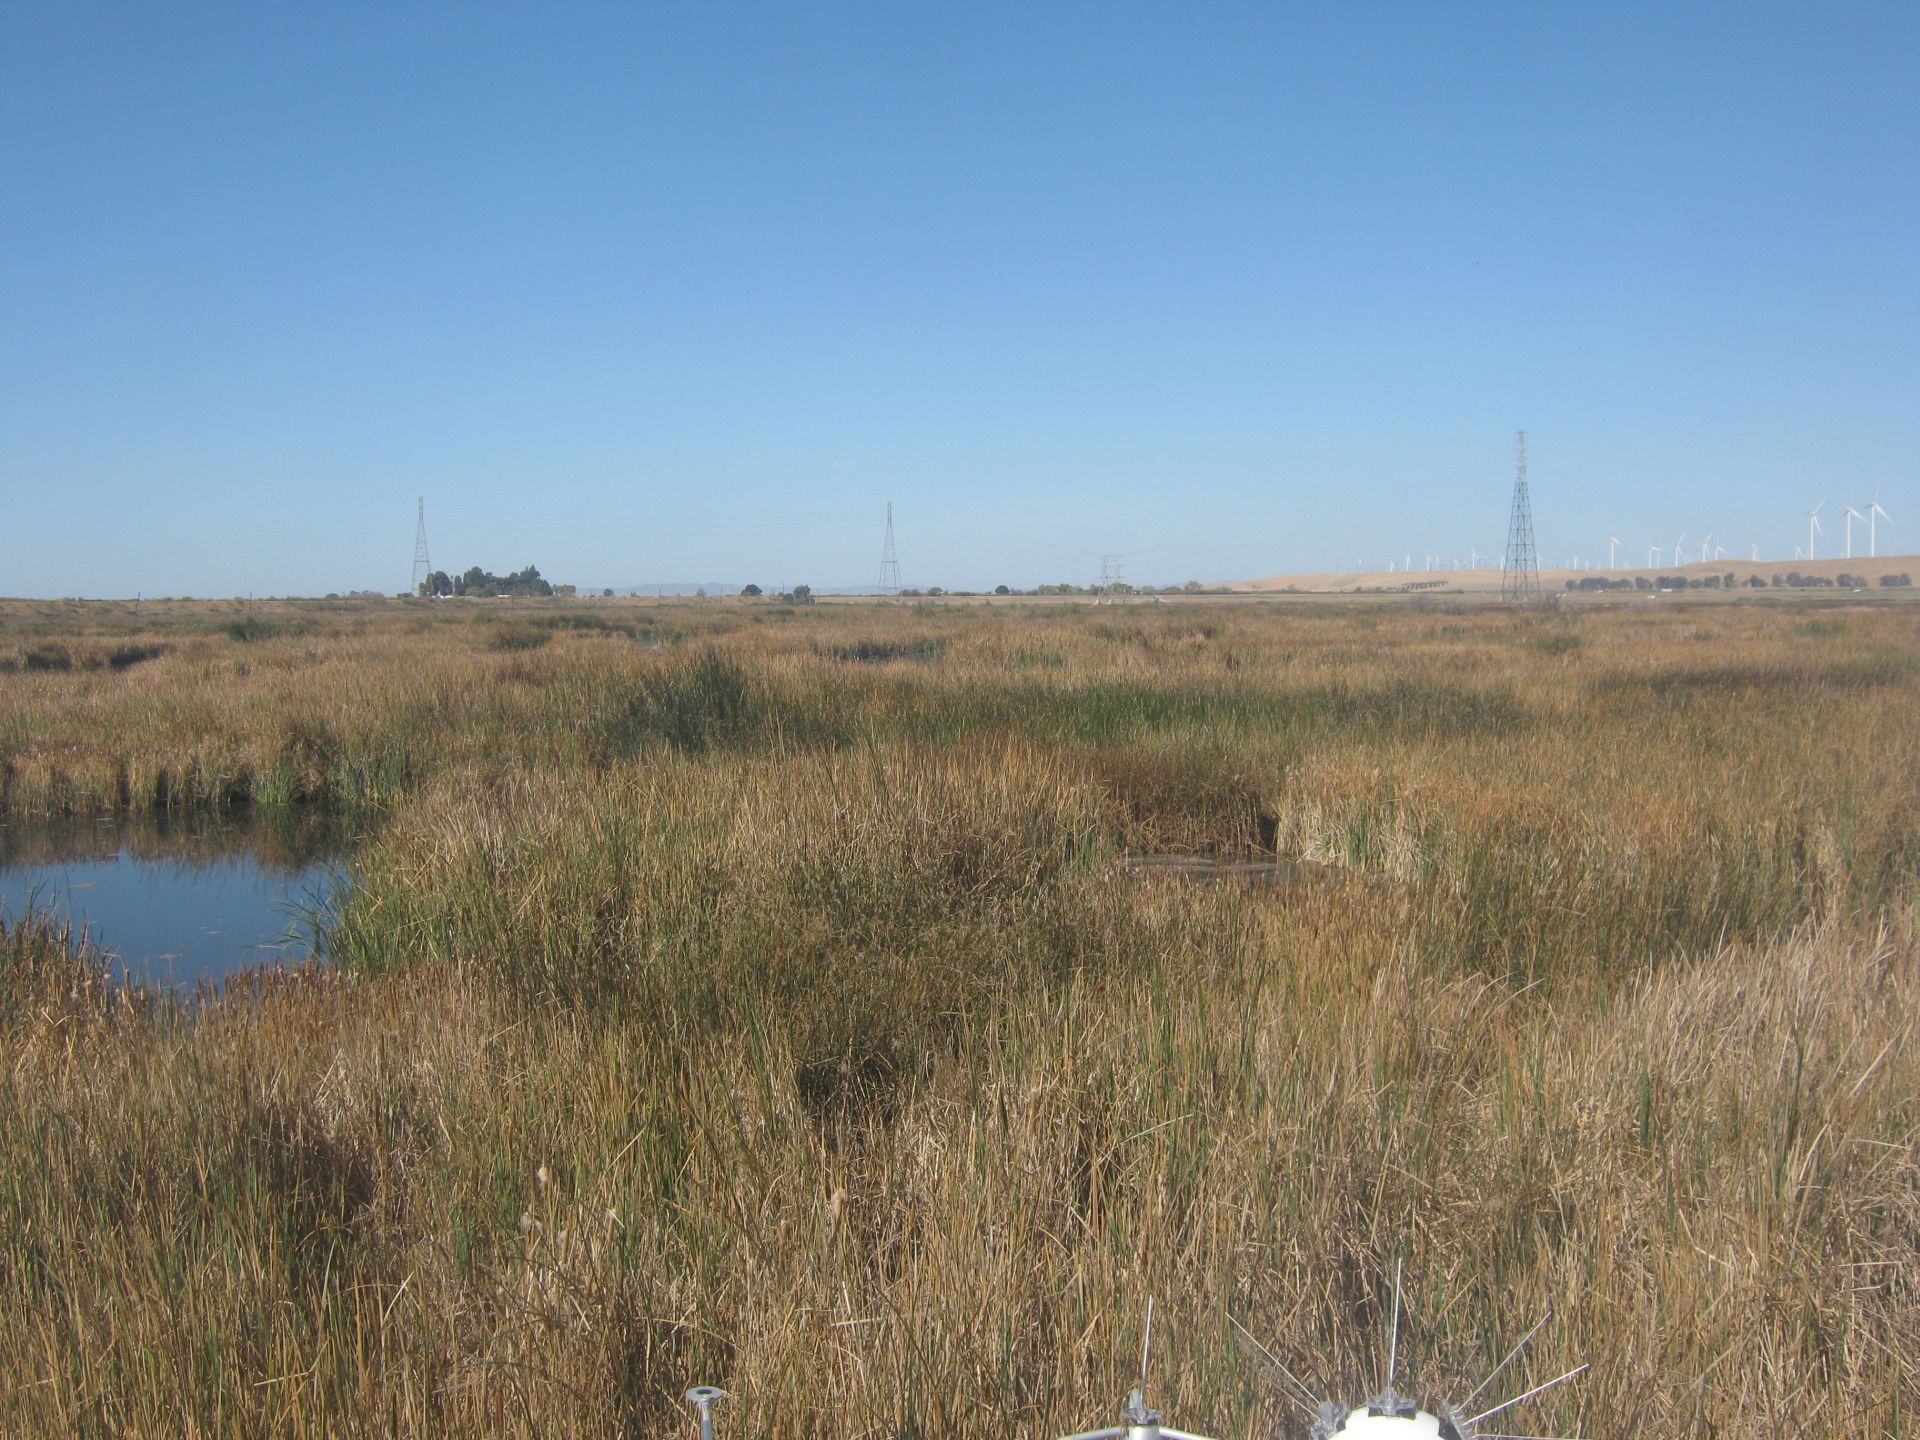
MB_autocam_20141003_1115.jpg ( 2014-10-03 11:15:02 ) Full size: 1920x1440
Ameriflux equipment being removed

Graphs display:
11 sets found

7 MB_flux graphs found

Explore the graph:Sonic Wind in a new window

Explore the graph:LI7700 mV signals in a new window

Explore the graph:Counts in a new window

Explore the graph:LI7700 CH4 from analog signal in a new window

Explore the graph:LI7500 CO2 and H2O in a new window

Explore the graph:LI7700 CH4 from digital signal in a new window

Explore the graph:CO2 in ppm in a new window

No data found for MB_met.
28 MB_tule graphs found

Explore the graph:MB Tule Tower: Open Water 2 (3/1/11-3/23/17) in a new window

Explore the graph:MB Tule Tower: Open Water 1 (3/1/11-2/21/13) in a new window

Explore the graph:MB Tule Tower: Tule Temps 2 & 3 (3/1/11-3/19/14) in a new window

Explore the graph:MB Tule Tower: Tule Temps 1 (3/1/11-3/19/14) in a new window

Explore the graph:Mayberry Tule Tower: Solar Radiation in a new window

Explore the graph:Mayberry Tule Tower: Disolved Oxygen in a new window

Explore the graph:Mayberry Tule Tower: IRT and Sensor Temp in a new window

Explore the graph:Mayberry Tule Tower: Volts and RH in a new window

Explore the graph:LED NDVI Sensor in a new window

Explore the graph:Water CO2 in a new window

Explore the graph:Water Pressure in a new window

Explore the graph:Fluorometer Data in a new window

Explore the graph:Mayberry pCO2 Profile in a new window

Explore the graph:Water Temperatures in a new window

Explore the graph:Air Temperatures in a new window

Explore the graph:Air Pressure in a new window

Explore the graph:4-Way Radiometer in a new window

Explore the graph:MB Tule Tower: Open Water 1 (2/21/13-3/19/14) in a new window

Explore the graph:MB Tule Tower: Tule Temps 1 (3/19/14-now) in a new window

Explore the graph:MB Tule Tower: Open Water 1 (3/19/14-now) in a new window

Explore the graph:MB Tule Tower: Tule Temps 2 & 3 (3/19/14-3/23/17) in a new window

Explore the graph:MB Tule Tower: Tule Temps 2 (3/23/17-now) in a new window

Explore the graph:MB Tule Tower: Tule Temps 3 (3/23/17-now) in a new window

Explore the graph:SRS NDVI Channels in a new window

Explore the graph:SRS NDVI in a new window

Explore the graph:Net Radiation in a new window

Explore the graph:Conductivity in a new window

Explore the graph:Soil electrical conductivity in a new window

Can't check MBWPEESWGT_mixed
1 MB_cam graphs found

Explore the graph:Mayberry Autocam GCC in a new window

Can't check MBEEWPSWEPGT_cam
Can't check SIMBTWEE_met
No data found for MB_minidot.
Can't check MBSWEEWPBCBA
1 MB_processed graphs found

Explore the graph:Mayberry processed CO2 Fluxes in a new window

Can't check MB_fd
1 MB_fd graphs found

Explore the graph:Water Forced Diffusion CO2 Flux in a new window