
Field Notes
<--2014-09-11 09:15:00 | 2014-10-07 08:00:00-->Other sites visited today: Tonzi
Phenocam link: Searching...
Vaira: 2014-09-30 09:30:00 (DOY 273)
Author: Joe Verfaillie
Others: Siyan
Summary: Standard field work, a little rain last week, started upgrading fence to barbed wire.
| Vaira 2014-09-30 I arrived with Siyan about 9:30. It was clear, sunny and hot with a nice breeze that seemed to change direction over the day. It rained last week and there was a little mud in the water hole. The ground felt less brittle, but still dry. The trees still look pretty good, but the rain might have just knocked off the brown leaves. Siyan did the standard field work while I worked on upgrading the fence. I added braces to the corner posts with new T-posts and Wedge-Lok hardware. I removed the electric wires and started running five strands of barbed wire at 8†spacing. I got the bottom, middle and top strands run before I ran out of time and steam. I took Siyan to Tonzi part way through and brought back some boardwalks to raise the solar panels out of the dirt. |
Field Data
No tank data
Well Depth
| Date | Location | Depth (feet) |
|---|---|---|
| 2014-09-30 | TZ_floor | 31.9 |
| 2014-09-30 | TZ_road | 39.6 |
| 2014-09-30 | TZ_tower | 36.4 |
mode = both
Moisture Point Probes TZ
Array
(
[0] => Tower_1
[1] => Floor_South_1
[2] => Floor_East_1
[3] => Floor_West_1
[4] => SoilCO2_1
[5] => Soil_Transect_4_1
[6] => Soil_Transect_3_1
[7] => Soil_Transect_2_1
[8] => Soil_Transect_1_1
[9] => SoilCO2_West_A_1
[10] => SoilCO2_West_B_1
[11] => SoilCO2_West_C_1
[12] => Tower_2
[13] => Floor_South_2
[14] => Floor_East_2
[15] => Floor_West_2
[16] => SoilCO2_2
[17] => Soil_Transect_4_2
[18] => Soil_Transect_3_2
[19] => Soil_Transect_2_2
[20] => Soil_Transect_1_2
[21] => SoilCO2_West_A_2
[22] => SoilCO2_West_B_2
[23] => SoilCO2_West_C_2
[24] => Tower_3
[25] => Floor_South_3
[26] => Floor_East_3
[27] => Floor_West_3
[28] => SoilCO2_3
[29] => Soil_Transect_4_3
[30] => Soil_Transect_2_3
[31] => Soil_Transect_1_3
[32] => SoilCO2_West_A_3
[33] => SoilCO2_West_B_3
[34] => SoilCO2_West_C_3
[35] => Floor_South_4
[36] => SoilCO2_4
[37] => Soil_Transect_4_4
[38] => Soil_Transect_3_4
[39] => Soil_Transect_2_4
[40] => Soil_Transect_1_4
[41] => SoilCO2_West_A_4
[42] => SoilCO2_West_B_4
[43] => SoilCO2_West_C_4
[44] => Soil_Transect_3_3
[45] => Floor_East_4
[46] => Floor_West_4
)
| Date | DOY | Rep | Depth | Tower_1 |
Floor_South_1 |
Floor_East_1 |
Floor_West_1 |
SoilCO2_1 |
Soil_Transect_4_1 |
Soil_Transect_3_1 |
Soil_Transect_2_1 |
Soil_Transect_1_1 |
SoilCO2_West_A_1 |
SoilCO2_West_B_1 |
SoilCO2_West_C_1 |
Tower_2 |
Floor_South_2 |
Floor_East_2 |
Floor_West_2 |
SoilCO2_2 |
Soil_Transect_4_2 |
Soil_Transect_3_2 |
Soil_Transect_2_2 |
Soil_Transect_1_2 |
SoilCO2_West_A_2 |
SoilCO2_West_B_2 |
SoilCO2_West_C_2 |
Tower_3 |
Floor_South_3 |
Floor_East_3 |
Floor_West_3 |
SoilCO2_3 |
Soil_Transect_4_3 |
Soil_Transect_2_3 |
Soil_Transect_1_3 |
SoilCO2_West_A_3 |
SoilCO2_West_B_3 |
SoilCO2_West_C_3 |
Floor_South_4 |
SoilCO2_4 |
Soil_Transect_4_4 |
Soil_Transect_3_4 |
Soil_Transect_2_4 |
Soil_Transect_1_4 |
SoilCO2_West_A_4 |
SoilCO2_West_B_4 |
SoilCO2_West_C_4 |
Soil_Transect_3_3 |
Floor_East_4 |
Floor_West_4 |
Avg | Spacial Count |
Measurement Count |
|---|---|---|---|---|---|---|---|---|---|---|---|---|---|---|---|---|---|---|---|---|---|---|---|---|---|---|---|---|---|---|---|---|---|---|---|---|---|---|---|---|---|---|---|---|---|---|---|---|---|---|---|---|---|
| 2014-09-30 | 273 | 0 | nan | 10 | 6.5 | 8.4 | 11.1 | 7.7 | 11.5 | 10.6 | 7.7 | 6.5 | 11.8 | 9.7 | 5.9 | 8.1 | 12.1 | 11.1 | 7.5 | 6.6 | 9 | 14.2 | 11.2 | 2.6 | 6 | 10.9 | 10.9 | 16.8 | 10.9 | 6.4 | 10.6 | 2.3 | 9 | 15.6 | 12.9 | 14.3 | 14.3 | 13.1 | 6.7 | 16.2 | 9.9 | 17 | 17.3 | 9.9 | 15.3 | 9.6 | 15.9 | ||||||
| 2014-09-30 | 273 | 1 | nan | 8.3 | 7.1 | 9.9 | 8.3 | 14.7 | 9.3 | 10.9 | 14.8 | 7.5 | 6.6 | 29.5 | 16.2 | 10.3 | 11.1 | 12.3 | 2.3 | 4.7 | 16.5 | 11.8 | 23.5 | 12.2 | 13 | ||||||||||||||||||||||||||||
| 2014-09-30 | 273 | 2 | nan | 15.8 | 11.1 | 8.7 | |||||||||||||||||||||||||||||||||||||||||||||||
| 2014-09-30 | 273 | Avg | 0-15cm | 0 | 0 | ||||||||||||||||||||||||||||||||||||||||||||||||
| 2014-09-30 | 273 | Avg | 15-30cm | 0 | 0 | ||||||||||||||||||||||||||||||||||||||||||||||||
| 2014-09-30 | 273 | Avg | 30-45cm | 0 | 0 | ||||||||||||||||||||||||||||||||||||||||||||||||
| 2014-09-30 | 273 | Avg | 45-60cm | 0 | 0 |
mode = both
Moisture Point Probes VR
Array
(
[0] => Solar_Panels_1
[1] => Flux_Tower_1
[2] => Gate_1
[3] => Biomass_Cage_1
[4] => Solar_Panels_2
[5] => Flux_Tower_2
[6] => Gate_2
[7] => Biomass_Cage_2
[8] => Solar_Panels_3
[9] => Flux_Tower_3
[10] => Gate_3
[11] => Biomass_Cage_3
[12] => Solar_Panels_4
[13] => Flux_Tower_4
[14] => Gate_4
[15] => Biomass_Cage_4
)
| Date | DOY | Rep | Depth | Solar_Panels_1 |
Flux_Tower_1 |
Gate_1 |
Biomass_Cage_1 |
Solar_Panels_2 |
Flux_Tower_2 |
Gate_2 |
Biomass_Cage_2 |
Solar_Panels_3 |
Flux_Tower_3 |
Gate_3 |
Biomass_Cage_3 |
Solar_Panels_4 |
Flux_Tower_4 |
Gate_4 |
Biomass_Cage_4 |
Avg | Spacial Count |
Measurement Count |
|---|---|---|---|---|---|---|---|---|---|---|---|---|---|---|---|---|---|---|---|---|---|---|
| 2014-09-30 | 273 | 0 | nan | 7.1 | 3.6 | 5.3 | 3 | 7.2 | 3.5 | 2.9 | 2.6 | 13.1 | 3.4 | 8.1 | 10.9 | 26.8 | 11.3 | 8.7 | 14.5 | |||
| 2014-09-30 | 273 | 1 | nan | 8 | 7.1 | 6.8 | 3 | 6.9 | 3.9 | 7.2 | 2.3 | 13.4 | 2.8 | 17.3 | 11.5 | 26.2 | 11 | 10.1 | 13.9 | |||
| 2014-09-30 | 273 | Avg | 0-15cm | 0 | 0 | |||||||||||||||||
| 2014-09-30 | 273 | Avg | 15-30cm | 0 | 0 | |||||||||||||||||
| 2014-09-30 | 273 | Avg | 30-45cm | 0 | 0 | |||||||||||||||||
| 2014-09-30 | 273 | Avg | 45-60cm | 0 | 0 |
No TZ grass heigth found
No VR grass heigth found
No VR Tree DBH found
No water potential data found
No VR Grass Biomass data found
No VR OakLeaves Biomass data found
No VR PineNeedles Biomass data found
2 photos found
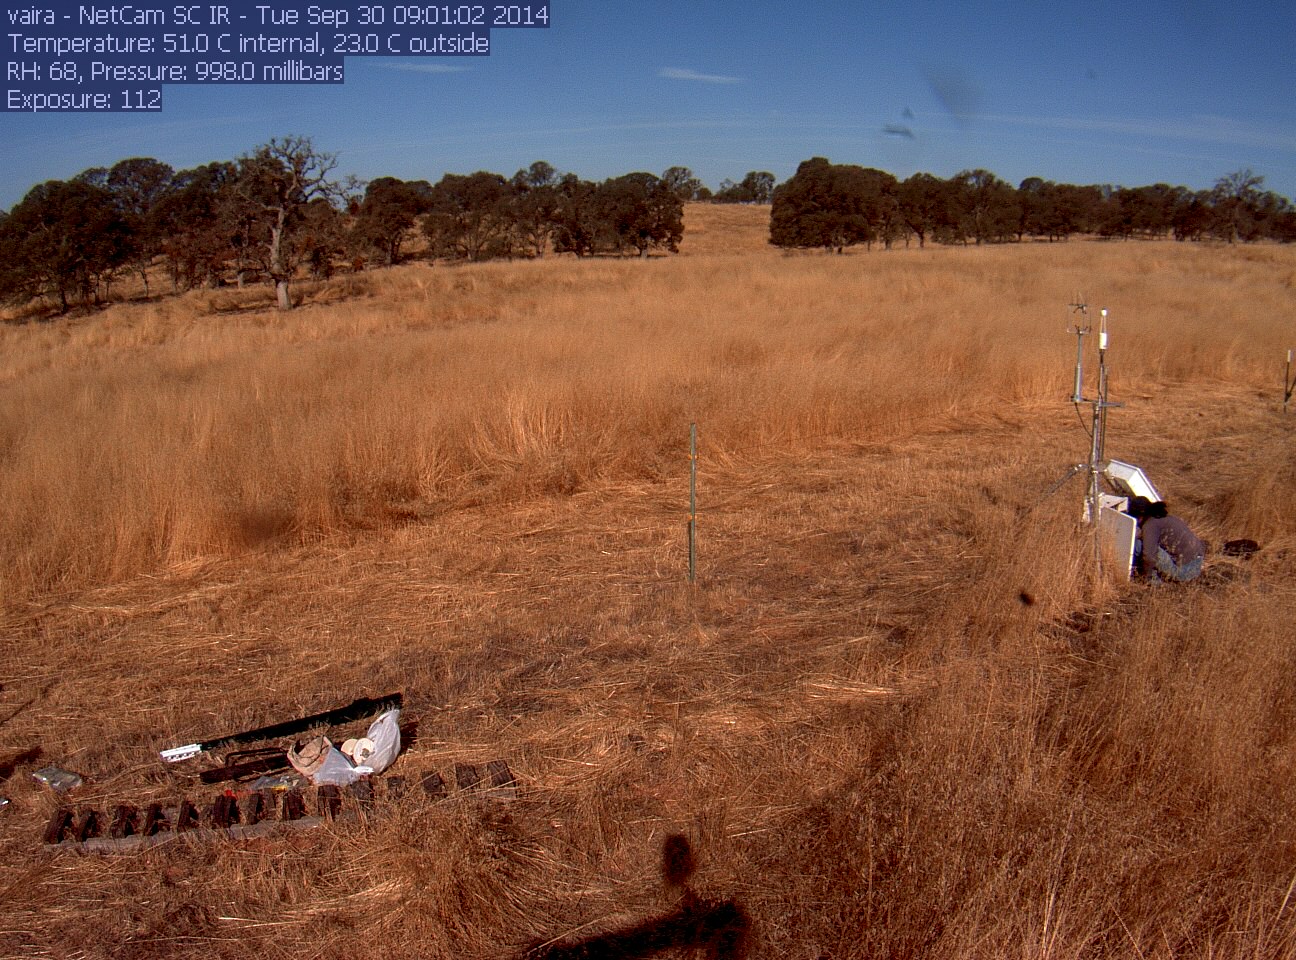
vaira_2014_09_30_090102.jpg ( 2014-09-30 15:59:20 ) Full size: 1296x960
Joe and Siyan on site
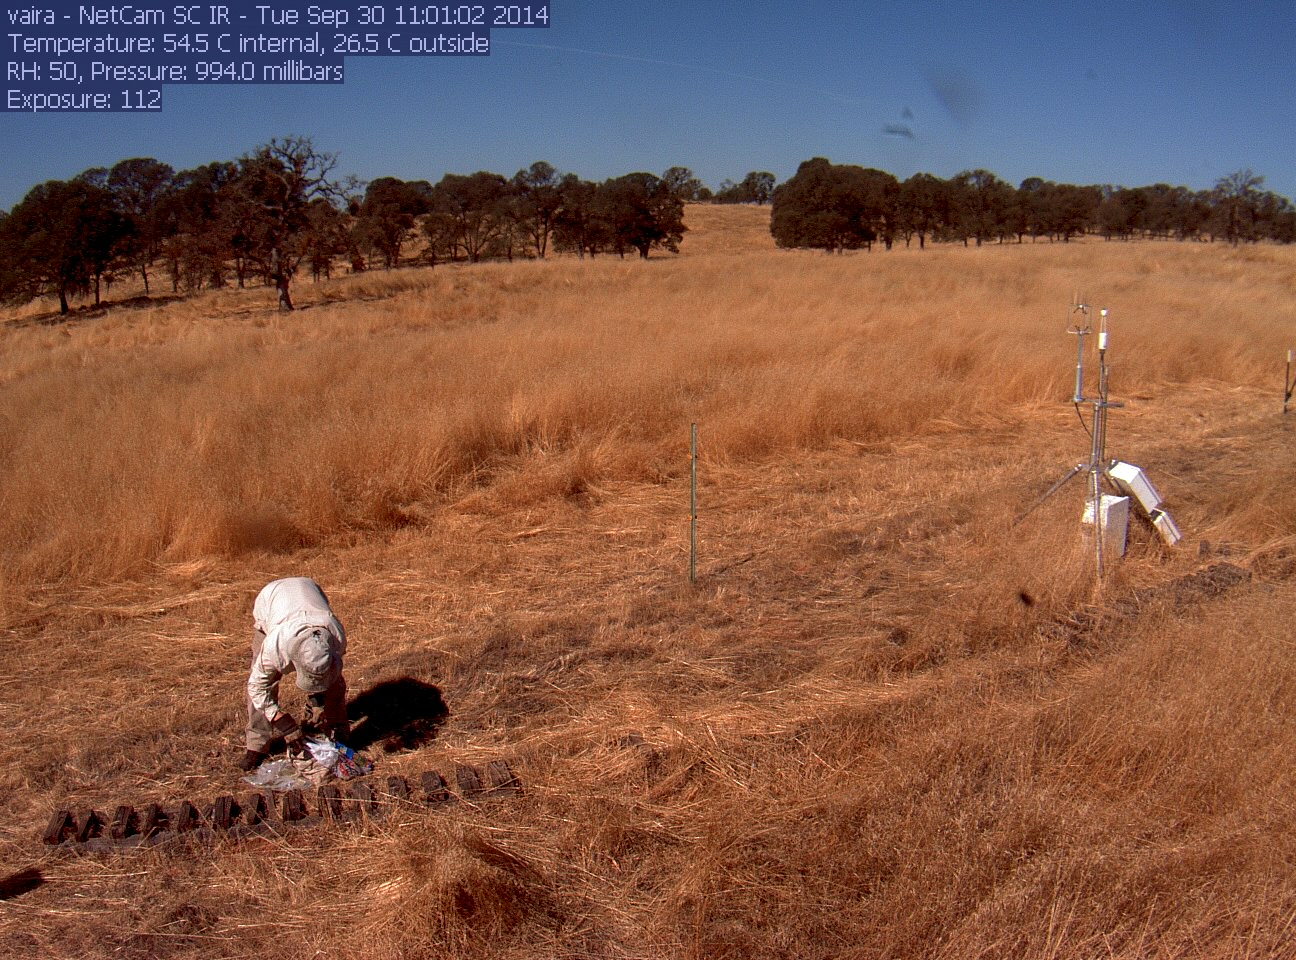
vaira_2014_09_30_110102.jpg ( 2014-09-30 17:59:22 ) Full size: 1296x960
Joe working on fence
9 sets found
16 VR_met graphs found
2 VR_flux graphs found
6 VR_soilco2 graphs found
No data found for VR_pond.
Can't check TZVR_mixed
No data found for VR_fd.
No data found for VR_processed.
No data found for VR_arable.
No data found for VR_soilvue.