
Field Notes
<--2014-08-07 11:15:00 | 2014-08-19 10:20:00-->Other sites visited today: Twitchell Alfalfa | Twitchell Rice | West Pond | East End | Sherman Island
Phenocam link: Searching...
Mayberry: 2014-08-13 15:30:00 (DOY 225)
Author: Joe Verfaillie
Others: Patty
Summary: Moved portable tower from High veg to low veg. Caterpillar infestation winding down. Water level close to normal
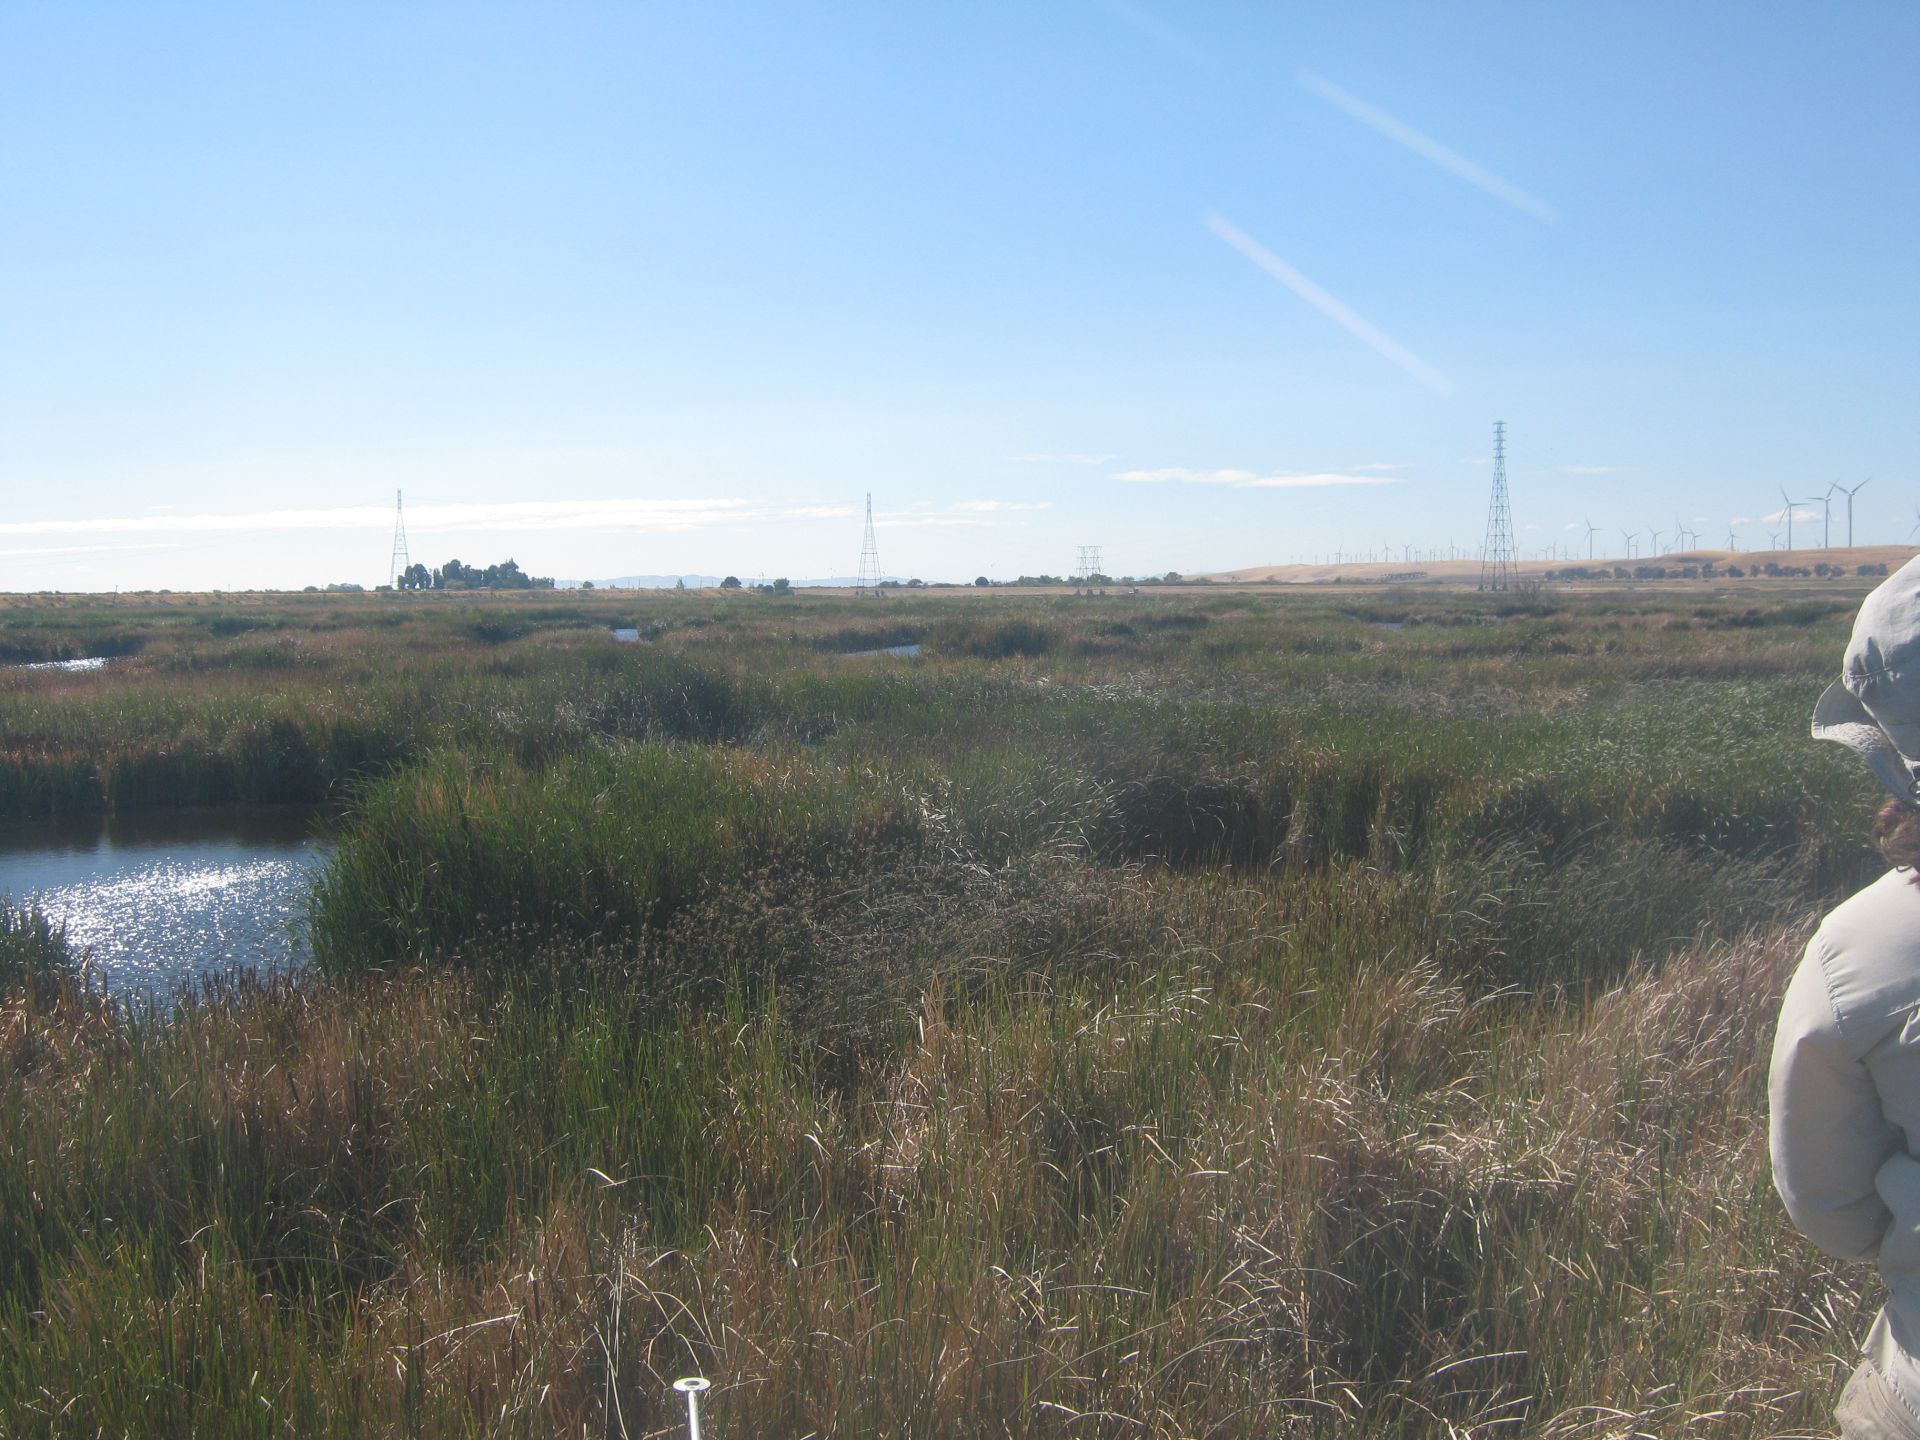
| Mayberry 2014-08-13 It was mostly clear and sunny with a strong wind from the west. I think the caterpillar infestation is winding down – I only saw two caterpillars. I could see the damage on individual leaves, but found it hard to see the special extent. Patty said the water level in Mayberry Slough was much higher, but I though it still looked about a foot below normal. Portable tower The speed of sound looked okay, and I couldn’t see anything wrong with the connector, so we decided to move the tower. Patty pulled the met box from the vegetation. I pulled down the 7700, packed the solar panel and we move the tower to the low veg site. We should have marked the tripod setting. At the low veg site it was hard to find marks on the tripod to change its level, but eventually we did and it seemed level. I aligned the sonic to north by eye, but did not measure the offset. Patty reinstalled the met box and notices that TC 4 did not seem to be working. She collected data from it. The 7700 read: 1.87ppm CH4, 47.4 RSSI – 73.0 after cleaning. The 7500 read: 391ppm CO2, 721mmol/m3 H2O, 90.77SS, 101.2kPa, 27.4C The bottom heat on the 7700 was set to always be on. I reset it for 18:00 to 7:00 I collected the GHG data. Permanent Tower At the permanent tower Patty took water sample. I didn’t notice the water level being abnormal. The 7700 read: 1.90ppm CH4, 46.5 RSSI – after cleaning is was good but I forgot to write down the number The 7500 read: 393.8ppm CO2, 814mmol/m3 H2O, 95.2SS, 101.2kPa, 27.5C Met was okay I collected GHG and met data. |
1 photos found
MB_autocam_20140813_1645.jpg ( 2014-08-13 16:45:03 ) Full size: 1920x1440
Joe on site
11 sets found
7 MB_flux graphs found
No data found for MB_met.
27 MB_tule graphs found
Can't check MBWPEESWGT_mixed
1 MB_cam graphs found
Can't check MBEEWPSWEPGT_cam
Can't check SIMBTWEE_met
No data found for MB_minidot.
Can't check MBSWEEWPBCBA
1 MB_processed graphs found
Can't check MB_fd
1 MB_fd graphs found