Field Notes

<--2014-07-31 10:00:00 | 2014-08-13 15:30:00-->
Other sites visited today: Sherman Island | Twitchell Rice | East End | West Pond | Twitchell Alfalfa
Phenocam link: Searching...

Mayberry: 2014-08-07 11:15:00 (DOY 219)
Author: Cove Sturtevant
Others: Sara

Summary: Downloaded data. Caterpillars continue to kill off veg. Water levels a bit low. Need brush to clean water CO2 probe mesh.

Mayberry
2014-08-07

Portable Tower
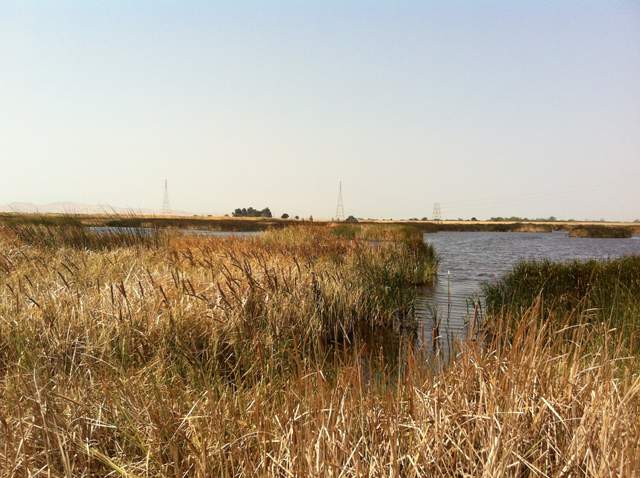
We arrived at the High Veg portable tower site at about 11:15 PDT. I checked the tower and downloaded the data while Sara took water samples. The water table has dropped ~10 cm but we saw Bryan later who said he had just restarted the pumps that morning. The caterpillars are definitely present at the High Veg site, but not as prevalent as other spots. We stopped at the Low Veg site afterward – the caterpillars have pretty much decimated the vegetation there. Took some photos of how much the veg has died off.

Readings
CO2: 367 ppm (410 after cleaning)
H2O: 970 mmol m-3 (730 after cleaning)
signal strength = 82.13% (91.76 after cleaning)
t: 24.9 °C
p = 101.3 kPa
sos = 346.5 m s-1
CH4: 1.95 ppm
RSSI: 46% (73% after cleaning)
Reservoir was full.

Permanent Tower
All well. Collected data. Took water samples. More caterpillar herbivory. Given the trend, all the cattails may be eaten by the end of summer!

Readings:
CO2: 391 ppm (400 after cleaning)
H2O: 840 mmol m-3 (780 after cleaning)
signal strength = 80.5% (95.3% after cleaning)
t: 26.2 °C
p = 101.2 kPa
sos = 348.0 m s-1
CH4 = 2.0 ppm (same after cleaning)
RSSI = 35% (63% after cleaning)
Reservoir almost full.
Met looked good.
Cleaned rad.

Sara noted that “there were a ton of disgusting bugs” living in the forerunner water co2 probe. She tried cleaning as best as possible, but we need papertowers or a toothbrush to clean it better next time.

1 photos found

Caterpillars have decimated the vegetation at our Low Veg site
20140807MB_LowVegCaterpillarDestruction.jpg ( 2014-08-07 11:55:49 ) Full size: 1920x1434
Caterpillars have decimated the vegetation at our Low Veg site

Graphs display:
11 sets found

7 MB_flux graphs found

Explore the graph:Sonic Wind in a new window

Explore the graph:LI7700 mV signals in a new window

Explore the graph:Counts in a new window

Explore the graph:LI7700 CH4 from analog signal in a new window

Explore the graph:LI7500 CO2 and H2O in a new window

Explore the graph:LI7700 CH4 from digital signal in a new window

Explore the graph:CO2 in ppm in a new window

No data found for MB_met.
27 MB_tule graphs found

Explore the graph:MB Tule Tower: Open Water 2 (3/1/11-3/23/17) in a new window

Explore the graph:MB Tule Tower: Open Water 1 (3/1/11-2/21/13) in a new window

Explore the graph:MB Tule Tower: Tule Temps 2 & 3 (3/1/11-3/19/14) in a new window

Explore the graph:MB Tule Tower: Tule Temps 1 (3/1/11-3/19/14) in a new window

Explore the graph:Mayberry Tule Tower: Solar Radiation in a new window

Explore the graph:Mayberry Tule Tower: Disolved Oxygen in a new window

Explore the graph:Mayberry Tule Tower: IRT and Sensor Temp in a new window

Explore the graph:Mayberry Tule Tower: Volts and RH in a new window

Explore the graph:LED NDVI Sensor in a new window

Explore the graph:Water CO2 in a new window

Explore the graph:Water Pressure in a new window

Explore the graph:Fluorometer Data in a new window

Explore the graph:Mayberry pCO2 Profile in a new window

Explore the graph:Water Temperatures in a new window

Explore the graph:Air Temperatures in a new window

Explore the graph:Air Pressure in a new window

Explore the graph:4-Way Radiometer in a new window

Explore the graph:MB Tule Tower: Open Water 1 (2/21/13-3/19/14) in a new window

Explore the graph:MB Tule Tower: Tule Temps 1 (3/19/14-now) in a new window

Explore the graph:MB Tule Tower: Open Water 1 (3/19/14-now) in a new window

Explore the graph:MB Tule Tower: Tule Temps 2 & 3 (3/19/14-3/23/17) in a new window

Explore the graph:MB Tule Tower: Tule Temps 2 (3/23/17-now) in a new window

Explore the graph:MB Tule Tower: Tule Temps 3 (3/23/17-now) in a new window

Explore the graph:SRS NDVI Channels in a new window

Explore the graph:SRS NDVI in a new window

Explore the graph:Net Radiation in a new window

Explore the graph:Conductivity in a new window

Can't check MBWPEESWGT_mixed
1 MB_cam graphs found

Explore the graph:Mayberry Autocam GCC in a new window

Can't check MBEEWPSWEPGT_cam
Can't check SIMBTWEE_met
No data found for MB_minidot.
Can't check MBSWEEWPBCBA
1 MB_processed graphs found

Explore the graph:Mayberry processed CO2 Fluxes in a new window

Can't check MB_fd
1 MB_fd graphs found

Explore the graph:Water Forced Diffusion CO2 Flux in a new window