Field Notes
<--2013-07-26 14:10:00 | 2013-08-05 14:00:00-->Other sites visited today: Mayberry | Twitchell Rice | DWR Corn | West Pond | Twitchell Alfalfa
Phenocam link: Searching...
Sherman Island: 2013-07-31 09:15:00 (DOY 212)
Author: Cove Sturtevant
Others: Dennis, Sara, Yanel
Summary: Standard field work. All well.
| Sherman 2013-07-31 We arrived about 09:15 PDT. It was sunny, breezy, and cool (18 C). There was a lot of water under the bridge on the way in and an east-west channel about 50 m north of the tower was brimming with water. However, the field in general was dry. The plants continue to senesce. Most are brown with dry flowers or dull green with white flowers. Vegetation height remains about 50 cm. I checked the tower and did well depth measurements while Dennis did moisture point, Sara did soil CO2 flux, and Yanel did spectral. Dennis and Yanel later did LAI measurements. LGR readings: 1.87 ppm, 09:22, 26.04 C, 1245 Torr (adjusted to 146 Torr), 12.54 us, 10 Hz 7500 readings: CO2: 15.9 mmol m-3 (same after cleaning) H2O: 630 mmol m-3 (same after cleaning) diag: 248 p: 101.8 kPa t: 21.3 C MET looked good. Soil CO2 looked good. Ref_ST_1 (which I noted last week to be reading 53.3 C) was down back in line with the other soil temp measurements. The CO2 sensor must have been on last week. |
1 photos found

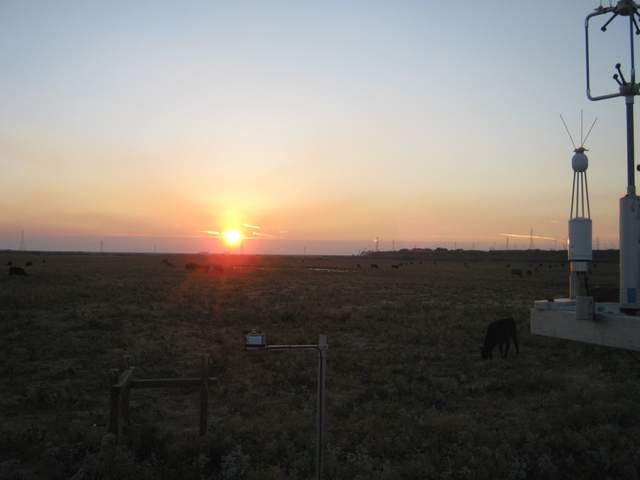
SI_autocam_20130730_1915.jpg ( 2013-07-30 19:15:02 ) Full size: 1920x1440
Nice sunset
7 sets found
No data found for SI_mp.
11 SI_met graphs found
Can't check SI_mixed
2 SI_mixed graphs found
4 SI_flx graphs found
3 SI_soilco2 graphs found
Can't check TWSI_mixed
Can't check SIMBTWEE_met

