
Field Notes
<--2012-10-18 10:15:00 | 2012-10-30 08:45:00-->Other sites visited today: Sherman Island | Twitchell Rice | West Pond | DWR Corn
Phenocam link: Searching...
Mayberry: 2012-10-25 10:15:00 (DOY 299)
Author: Cove Sturtevant
Others: Joe, Sara, Laurie
Summary: Disassembled and moved portable tower to Twitchell. Gave 7700 to USGS. Condensation inside main tower 7500, swapped with portable tower 7500 but readings funky too. Installed water pressure sensor from Twitchell.
| Mayberry 2012-10-25 Portable Tower We arrived at about 10:15 PDT at Location 1 without Joe, who was finishing the new fence around the power pole at Sherman. Clouds were breaking up and a light wind had started from the west. The Low Voltage Disconnect was not active when we arrived, so perhaps the adjustment of the solar panel improved the battery life last week. We disassembled the top portion of the portable tower, unhooked the battery and placed it on the floor of the cab. We gave the 7700 to the USGS folks while at Twitchell, left the solar panel inside the hut there, and took the 7500 and sonic back to the lab. See note for Mayberry main tower site (below) about switching out the permanent and portable tower 7500s. The portable tower truck is now parked outside the hut at Twitchell. Permanent tower Sara took water samples while Laurie and I downloaded the data and camera pics. Current 7700 readings: CH4 = 1.9 ppm RSSI = 86 after cleaning Reservoir 75% full Upon connecting to the 7500 (S/N 0065), we found the numbers to be wonky (co2 way too low and h2o way too high) and the agc at 56 (normally around 44) although the windows were dry and then recleaned. Upon inspection, there appeared to be condensation inside an interior lens of the bottom window. We swapped out the 7500 with the one from the newly dismantled portable tower (S/N 2180). We connected power back briefly to the portable tower 7550, downloaded the most recent configuration for S/N 2180 (all settings), and uploaded it to the permanent tower. The readings looked pretty normal, agc at 43.8. However, upon returning to the site at about 4pm to install the water pressure sensor from Twitchell, the 7500 readings were way off (CO2 and h2o too high, agc still 43.8). Joe investigated the coefficients and they looked fine. Now that I am writing up the notes, though, I see that the normal agc for S/N 2180 has been 37. Having both 7500s at Twitchell go out due to internal condensation seems unlikely to me, but we did have heavy rains. A look at the data from the portable tower right before we took it down should tell us whether the readings were bad before we swapped it, since the instruments looked dry and should have returned to normal. In any case, we will swap out S/N 2180 next week with a freshly calibrated 7500. Additionally, the sonic settings seemed to have been different between the permanent tower and the portable tower. When we uploaded the config file in the morning the sonic setting were changed to that of the portable tower and thus offset. While rechecking the system in the afternoon, Joe downloaded just the coefficients for the new 2180 head, uploaded the all the old settings from 0065 head (which corrected the sonics settings), and then uploaded just the coefficients for the new head. This fixed the sonic values, but no change to the 7500 values. Returning at 4pm, we also installed the water pressure sensor from Twitchell. Joe wrote some code on the fly for the different sensor and uploaded it to the 23x while I installed the sensor. This time, we zip-tied the pressure sensor to the southeast post of the tower scaffold instead of out in the channel. For future reference, the pink stripe on the sensor cable is at a height of 49in from the bottom (as measured by tape measure). At the time of install, the pressure sensor reading was 1.68 in the 23x and the water height at the sensor location was 44in. At this time, the water height out in the channel (where the previous sensor was installed) was 46in. Thus the channel location is 2in deeper than the new location at the foot of the scaffold. Laurie and I also repositioned the battery and solar panel for the camera. It was slumping and looked in danger of falling into the water. It is now closer to the tower and relatively safe. |
4 photos found
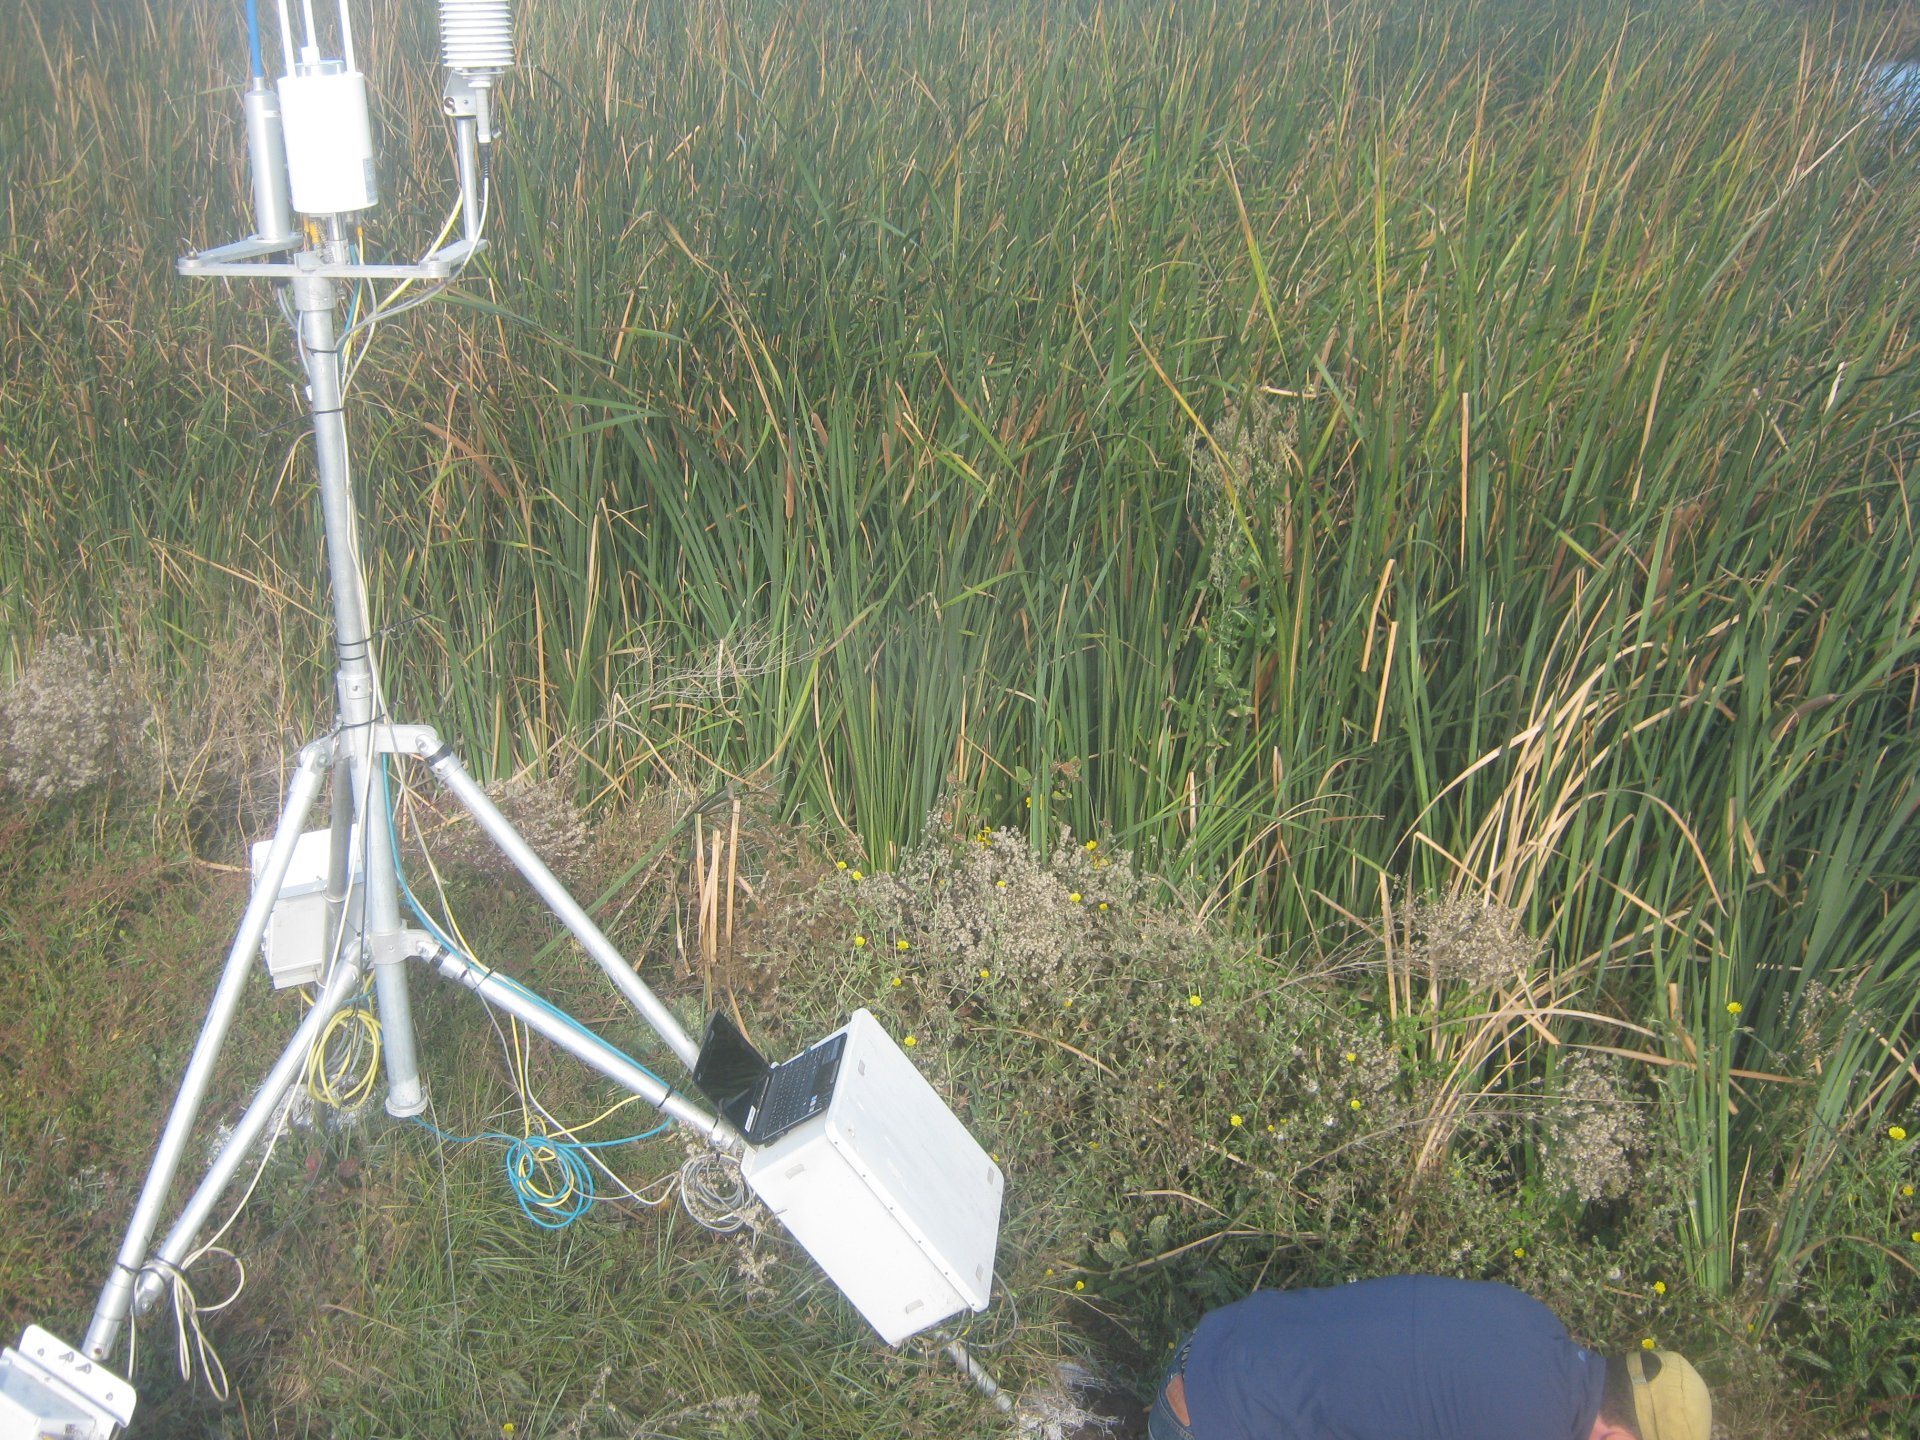
MB_autocam_20121025_1045.jpg ( 2012-10-25 10:45:02 ) Full size: 1920x1440
Field work
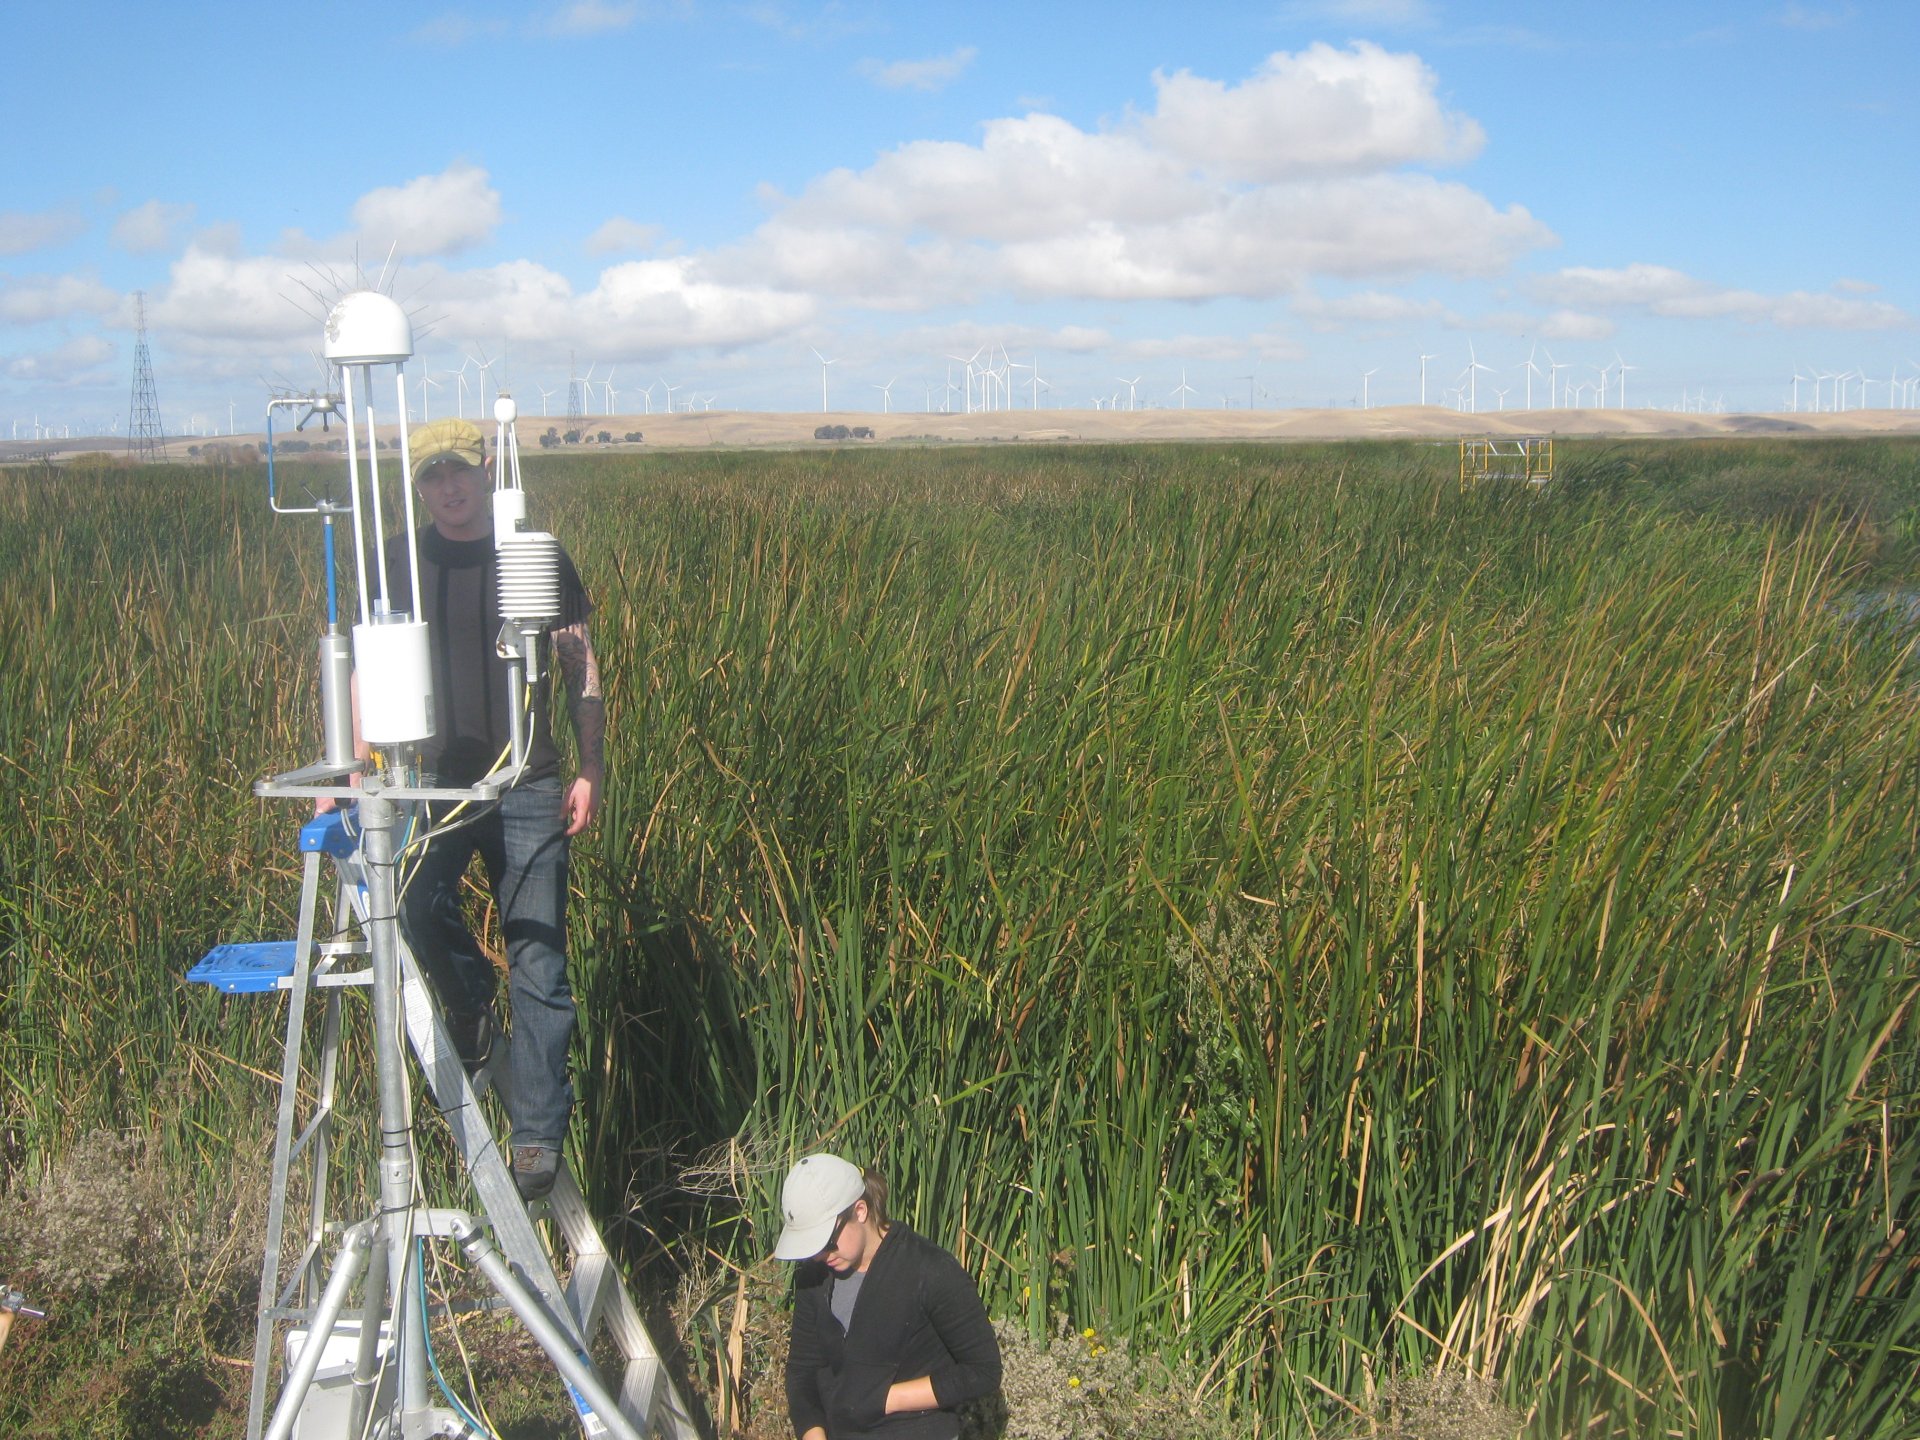
MB_autocam_20121025_1115.jpg ( 2012-10-25 11:15:02 ) Full size: 1920x1440
Field work
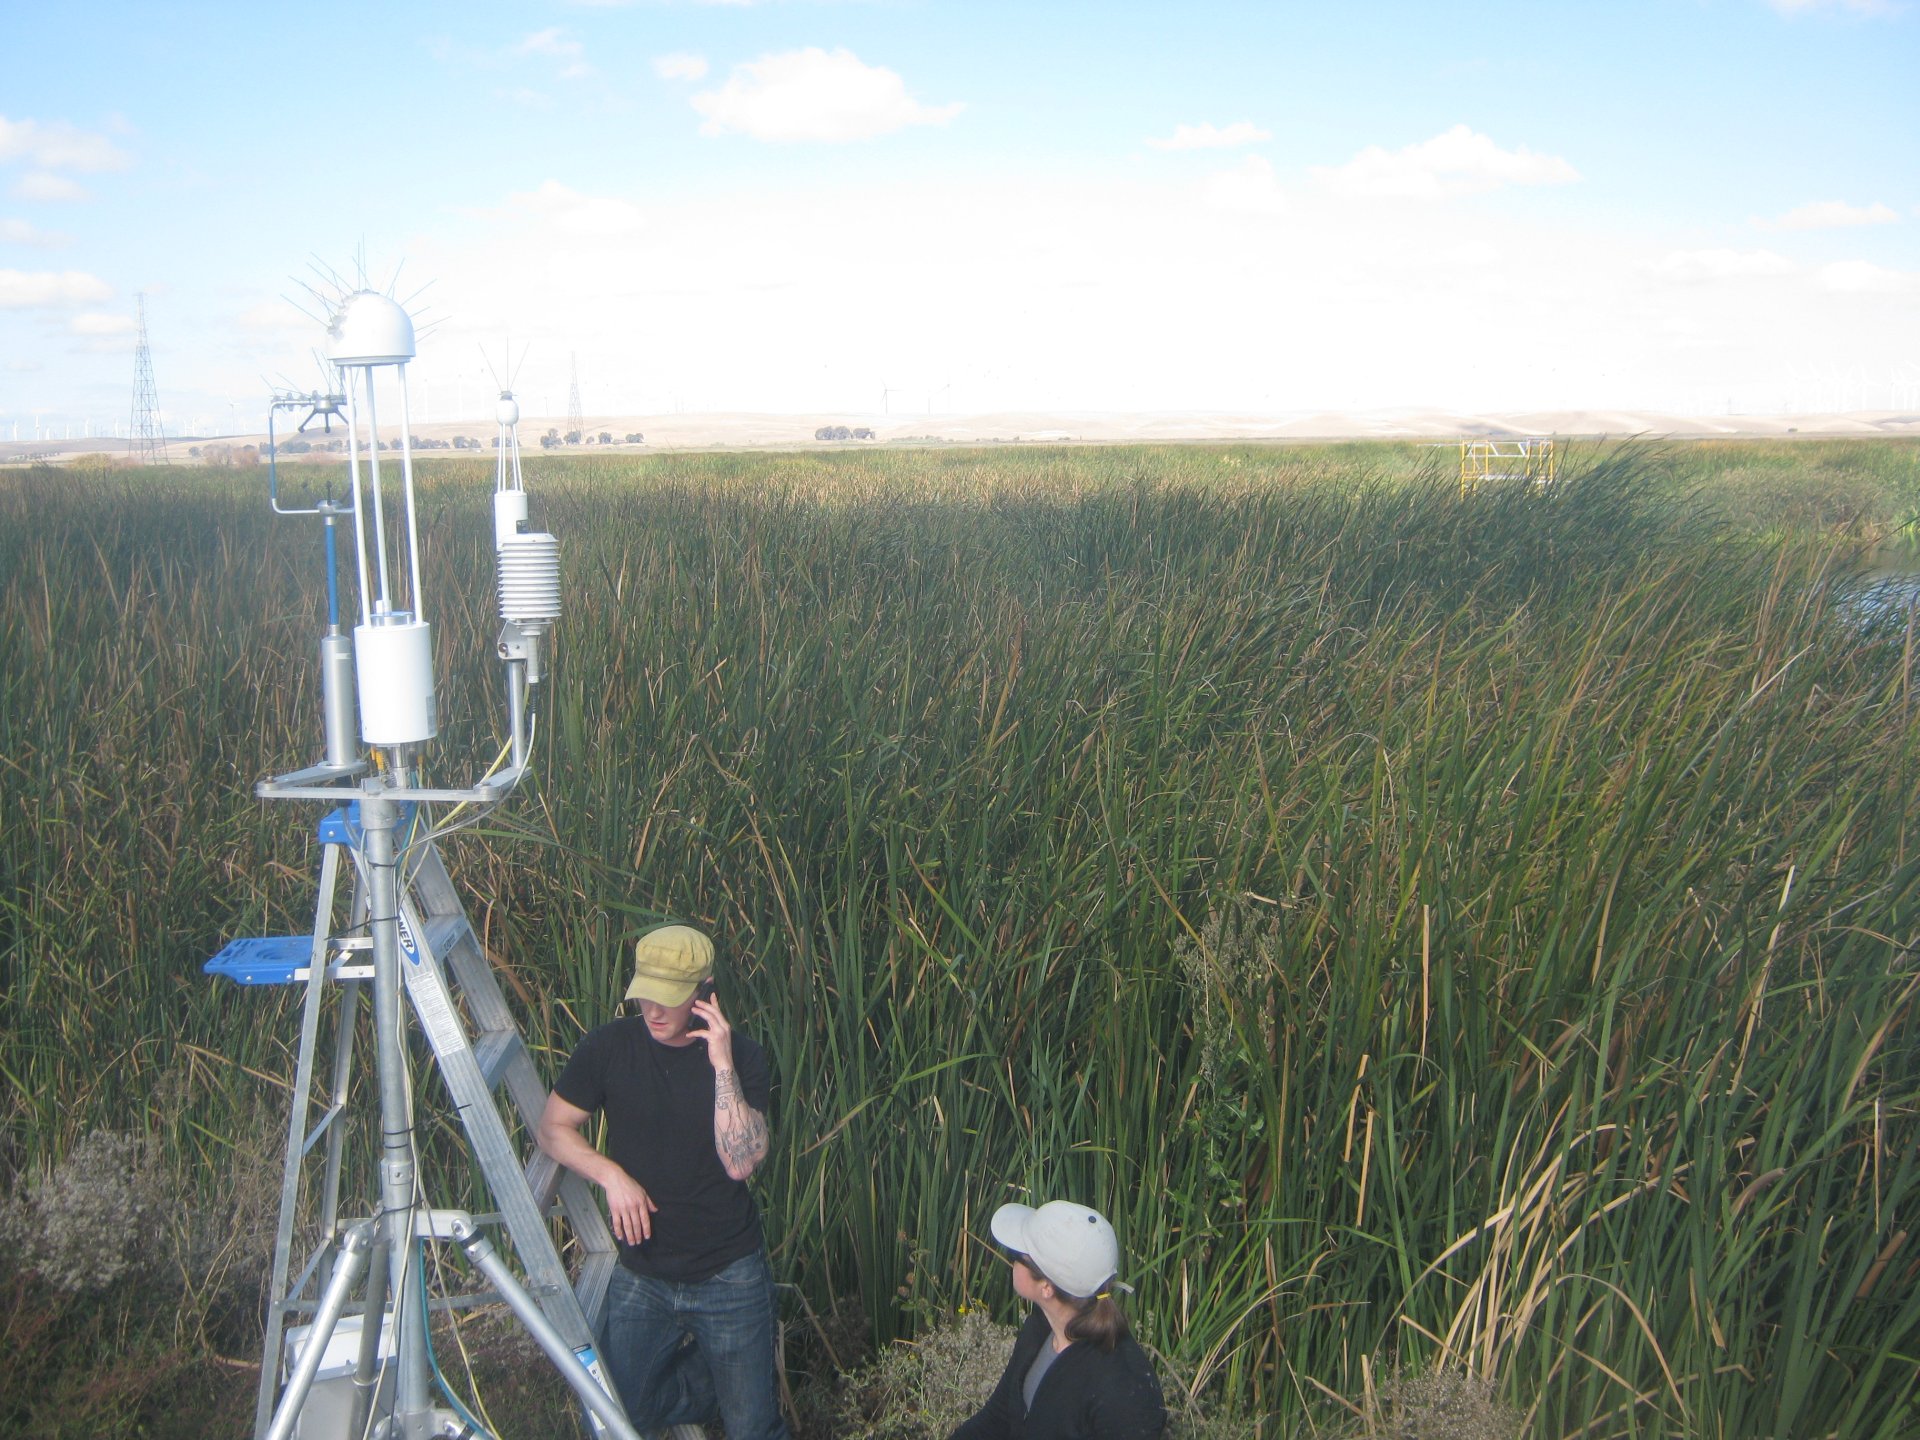
MB_autocam_20121025_1145.jpg ( 2012-10-25 11:45:03 ) Full size: 1920x1440
Phone call
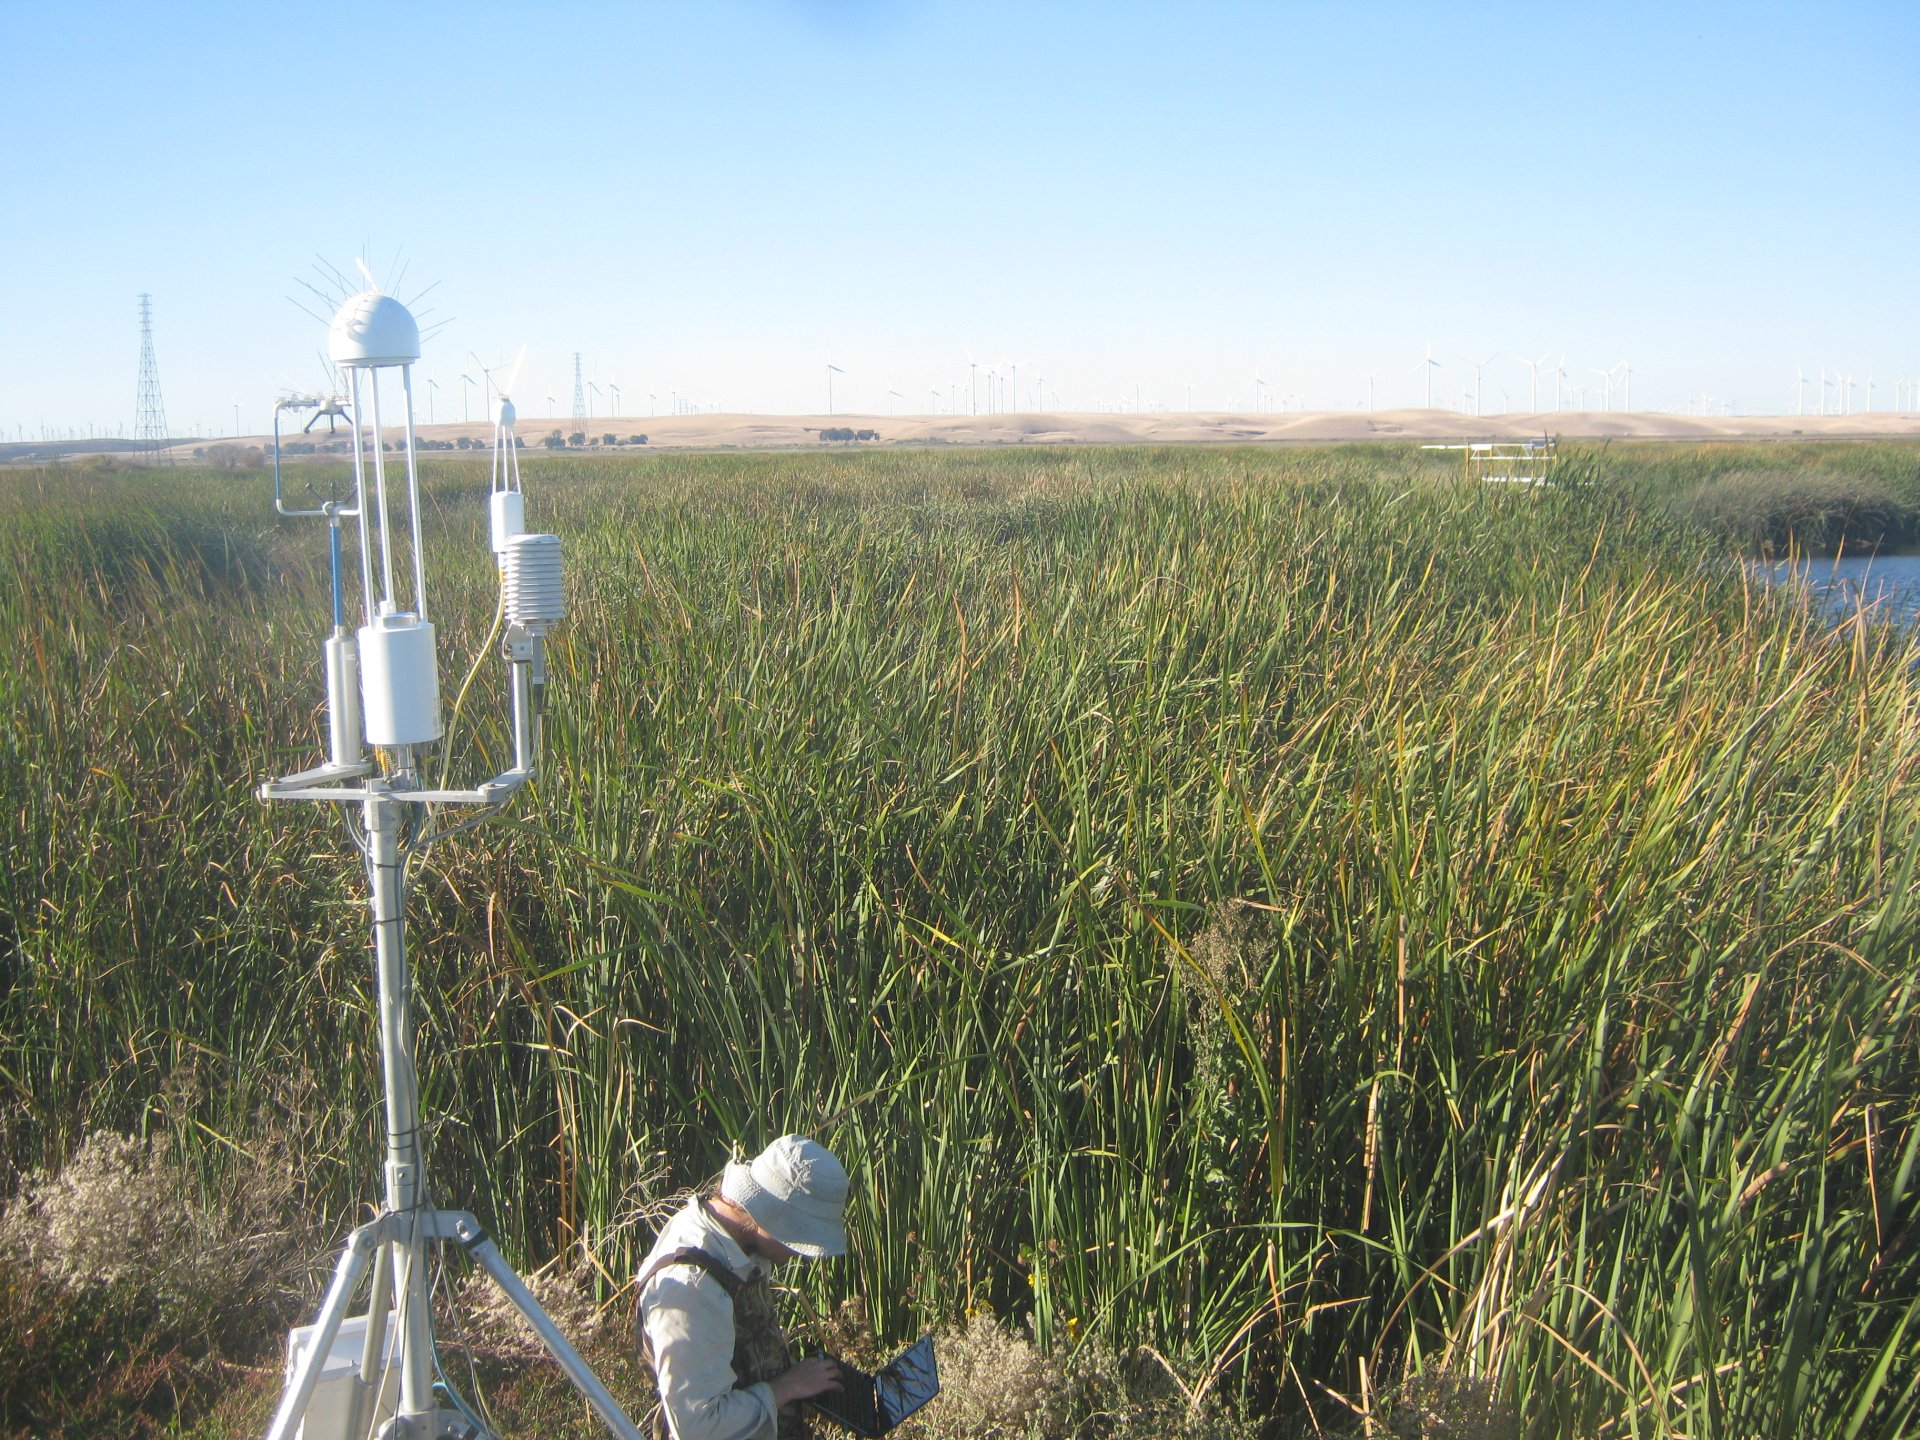
MB_autocam_20121025_1615.jpg ( 2012-10-25 16:15:02 ) Full size: 1920x1440
Joe on site
11 sets found
7 MB_flux graphs found
No data found for MB_met.
28 MB_tule graphs found
Can't check MBWPEESWGT_mixed
1 MB_cam graphs found
Can't check MBEEWPSWEPGT_cam
Can't check SIMBTWEE_met
No data found for MB_minidot.
Can't check MBSWEEWPBCBA
1 MB_processed graphs found
Can't check MB_fd
1 MB_fd graphs found