
Field Notes
<--2012-10-11 10:00:00 | 2012-10-25 10:15:00-->Other sites visited today: Sherman Island | Twitchell Rice | West Pond | DWR Corn
Phenocam link: Searching...
Mayberry: 2012-10-18 10:15:00 (DOY 292)
Author: Cove Sturtevant
Others: Joe, Sara, Laurie
Summary: Moved portable tower to Location 1 and put solar panel over windshield to maximize battery life. Took water samples at permanent tower. Tower looks good except for water pressure sensor which we had to pull for diagnostics in the lab.
| Mayberry
2012-10-18 Portable Tower We arrived at about 10:15 PDT at Location 2. Sunny, warm, no wind. The Low Voltage Disconnect was again active, although it looked just about to turn off with the battery at 12.5 V and good solar coming in. Joe and I moved the tower to Location 2 while Sara and Laurie went to the permanent tower. We moved the solar panel to rest over the windshield at about a 45 degree angle facing due south, so this should get us the best possible battery life short of adding another panel. We cleaned the sensors and started the portable tower back up. Readings: CH4 = 2.4 ppm RSSI = 69.7 after cleaning CO2 = 420 ppm H2O = 670 mmol m-3 agc = 37.5 t = 27 °C 7550 box logging 7700 reservoir full Permanent tower Sara and Laurie took water samples and checked the permanent tower readings. Current 7500 readings: CO2 = 425 ppm H2O = 550 mmol m-3 7700 readings: CH4 = 2.35 ppm RSSI = 55 (bumped to 85 after cleaning) reservoir full MET values looked fine, except the water pressure sensor was reading -INF. Joe and I went and checked it. All wiring looked good so we pulled the sensor to check out in the lab. We need to bring putty next time to plug the holes in the tower boxes at the permanent and portable sites. |
2 photos found
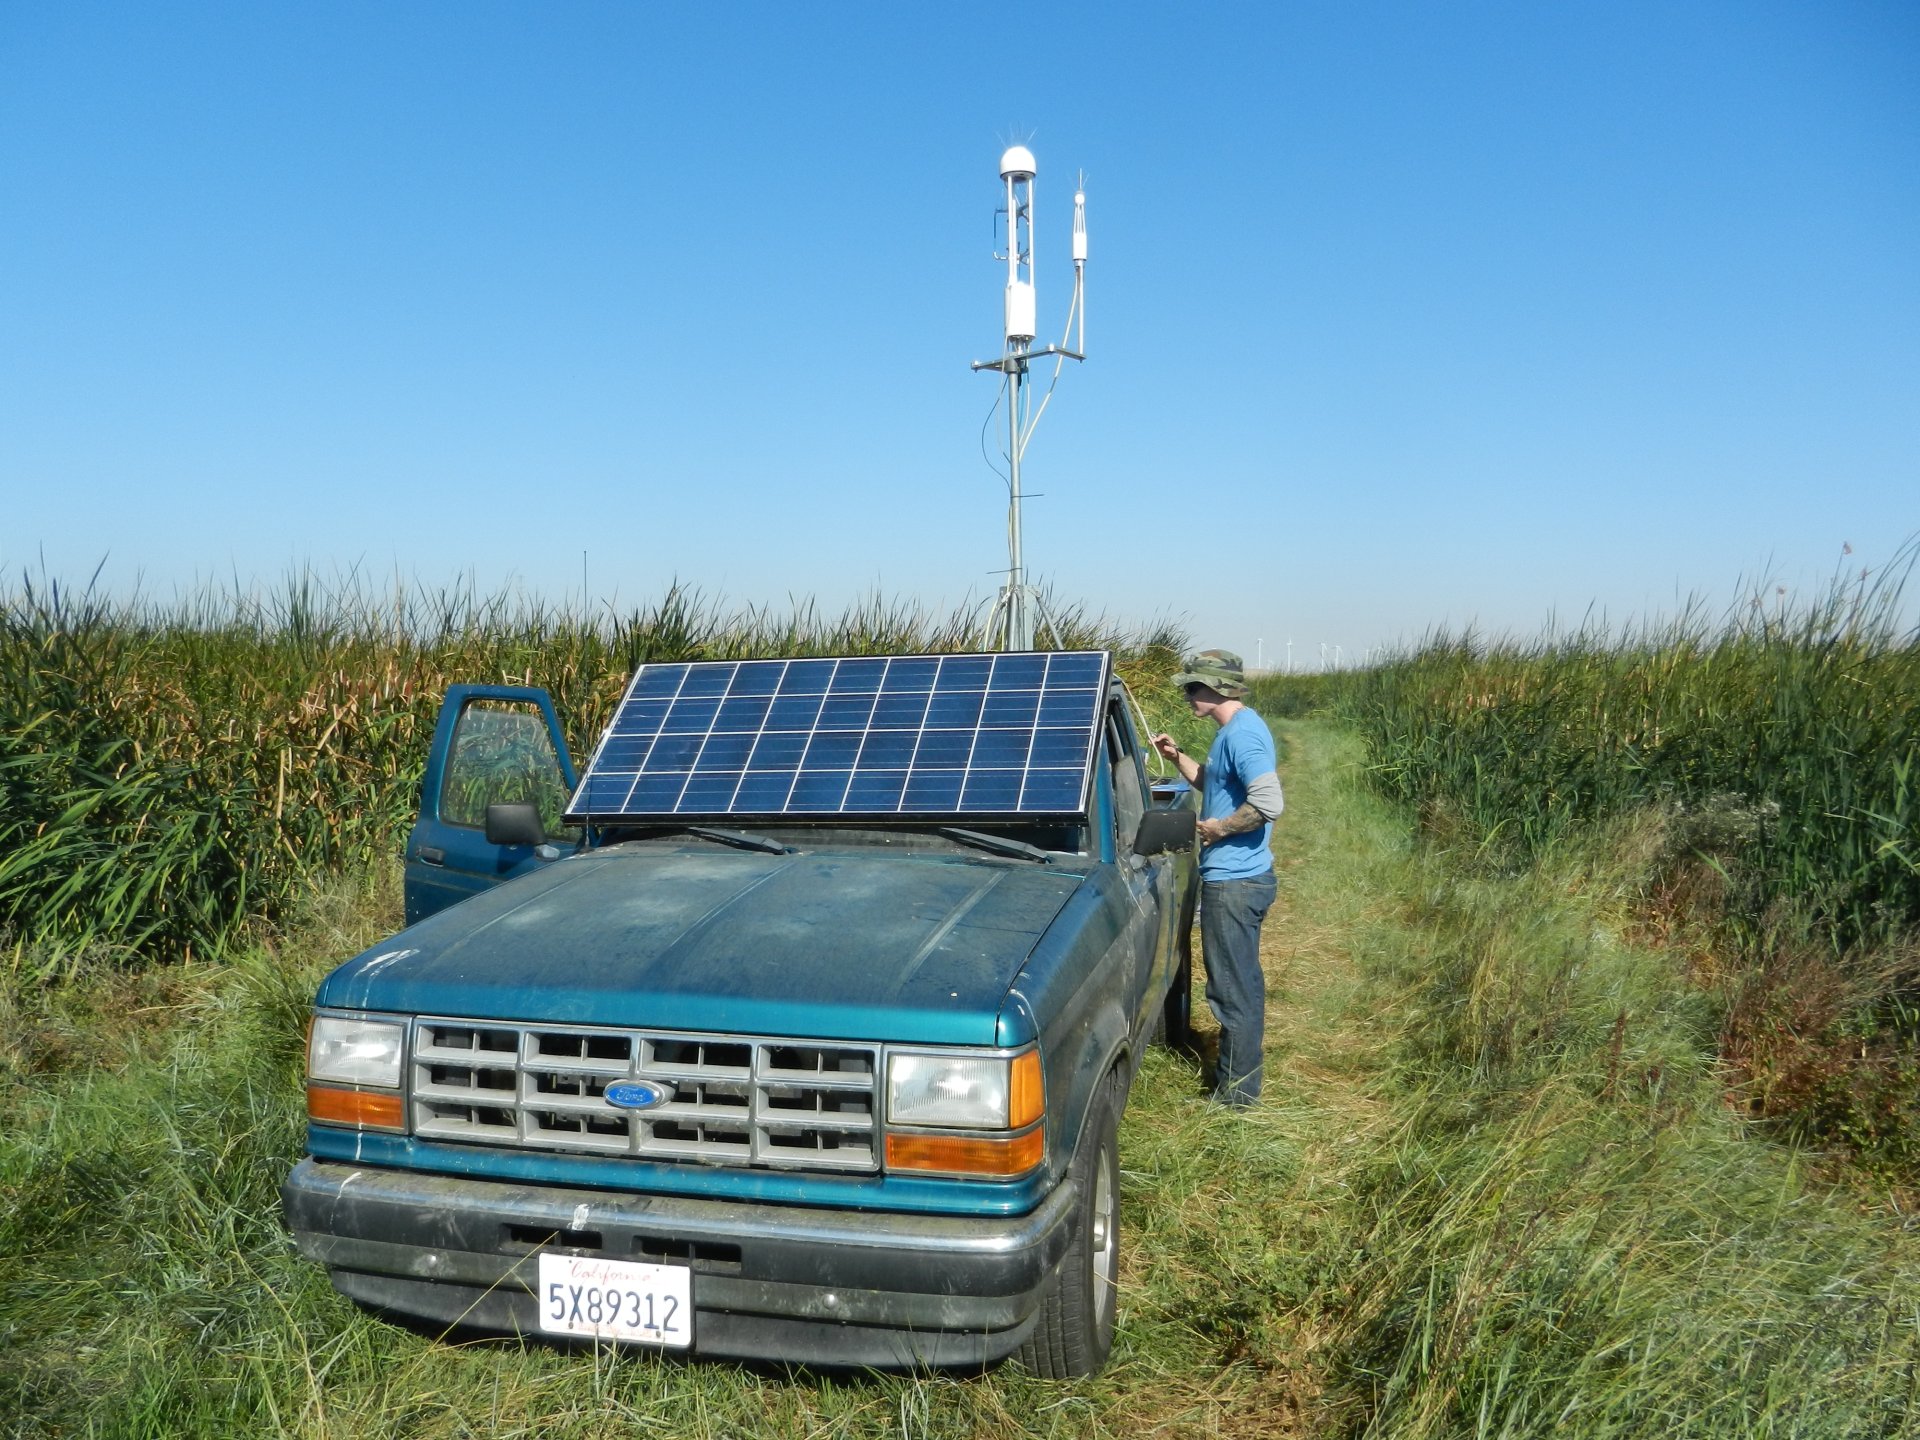
20121018MB_NewSolarMount1.jpg ( 2012-10-18 10:50:09 ) Full size: 1920x1440
We moved the solar panel to rest over the windshield at about a 45 degree angle facing due south
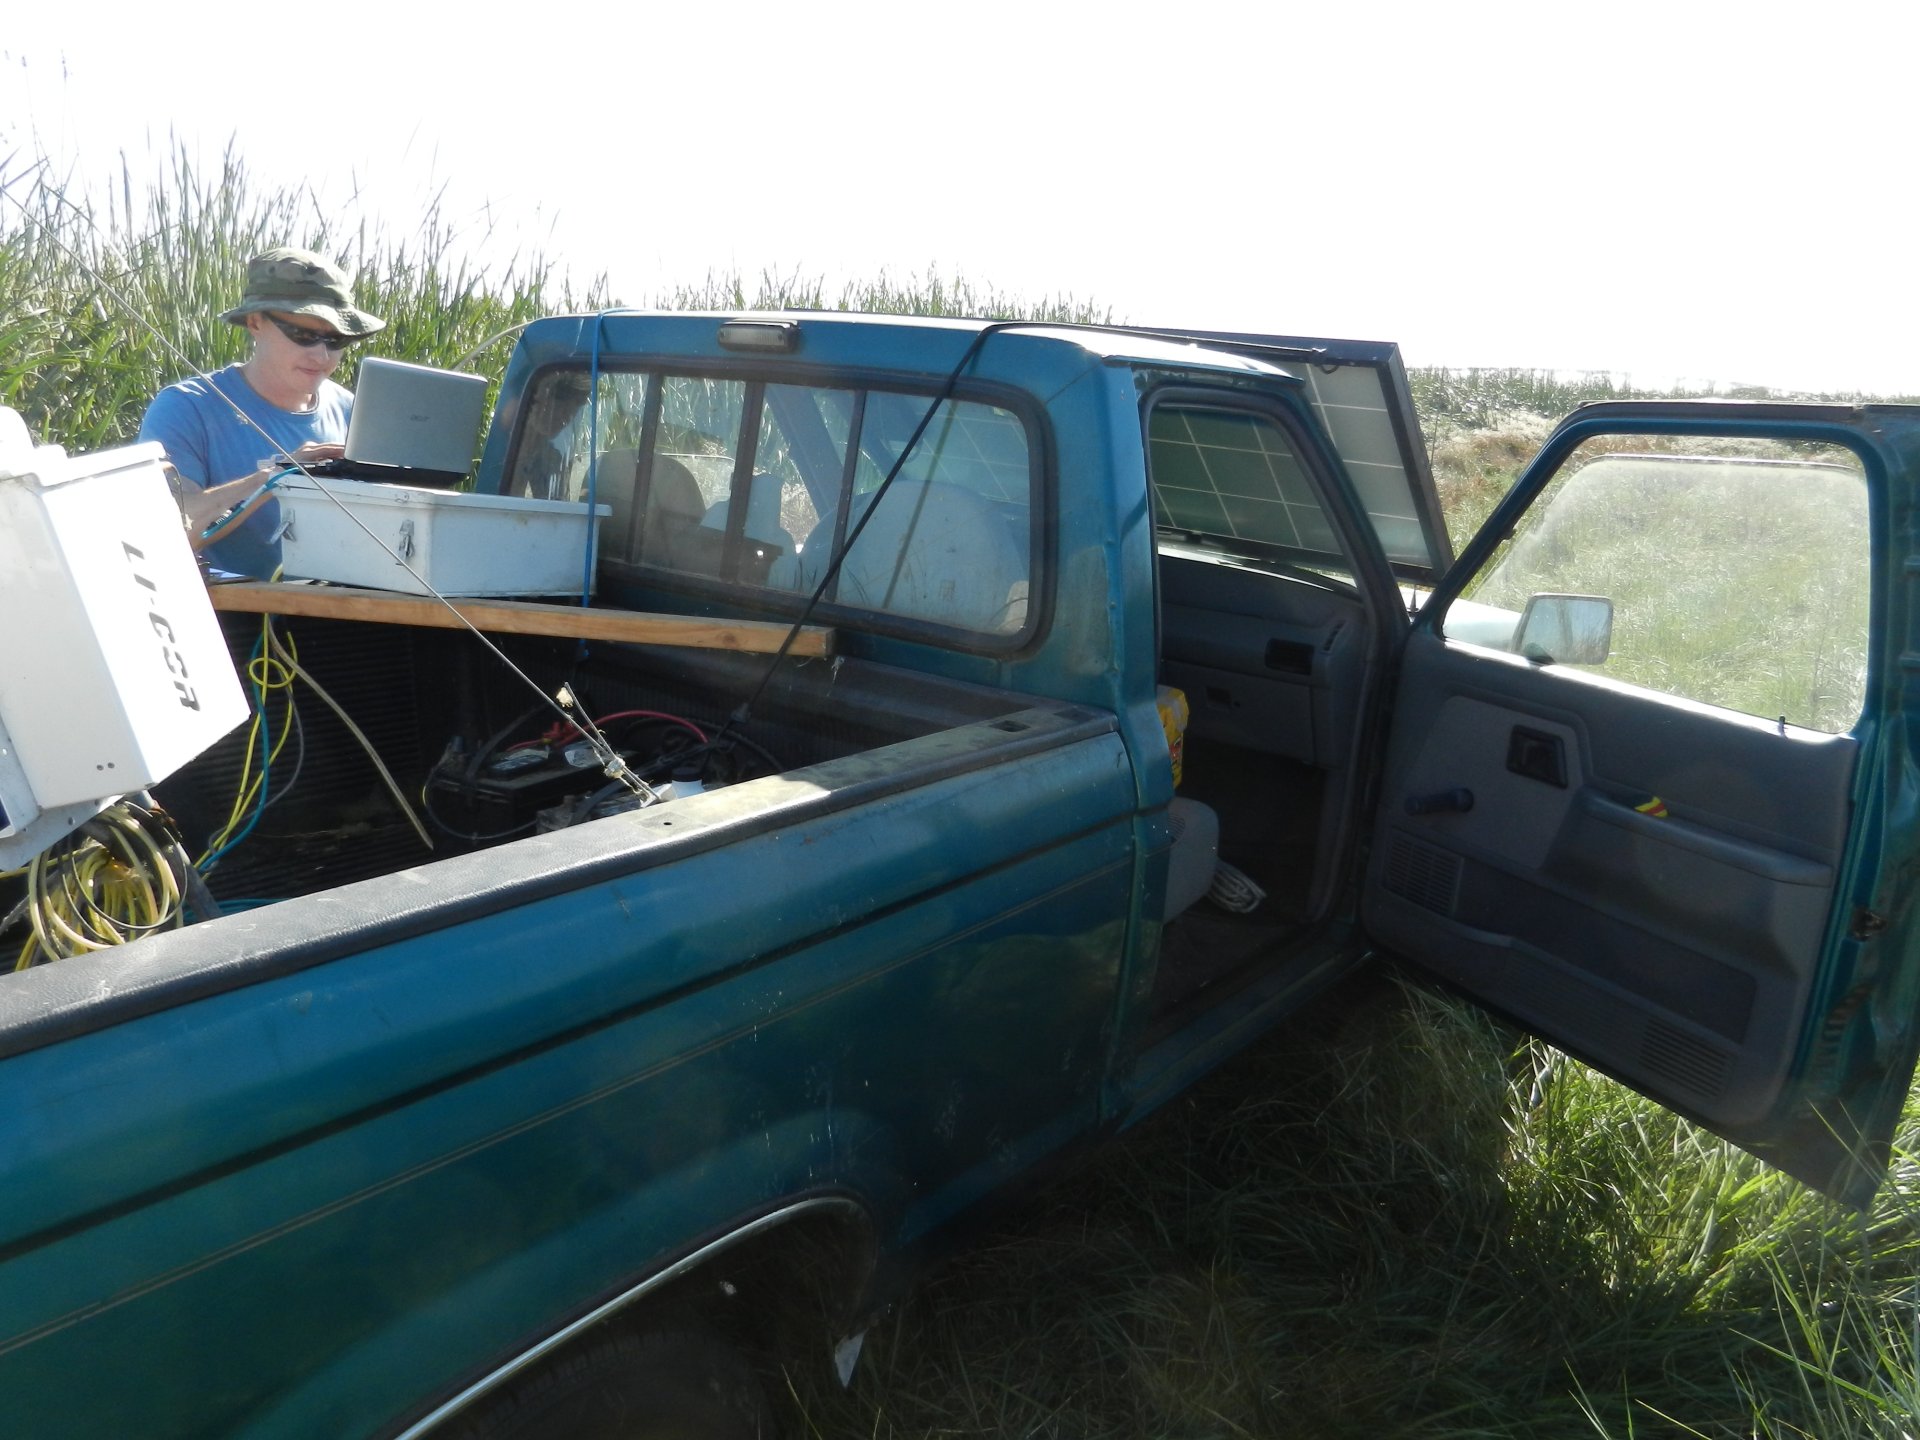
20121018MB_NewSolarMount2.jpg ( 2012-10-18 10:50:30 ) Full size: 1920x1440
We moved the solar panel to rest over the windshield at about a 45 degree angle facing due south
11 sets found
7 MB_flux graphs found
No data found for MB_met.
28 MB_tule graphs found
Can't check MBWPEESWGT_mixed
1 MB_cam graphs found
Can't check MBEEWPSWEPGT_cam
Can't check SIMBTWEE_met
No data found for MB_minidot.
Can't check MBSWEEWPBCBA
1 MB_processed graphs found
Can't check MB_fd
1 MB_fd graphs found