Field Notes
<--2012-10-18 09:20:00 | 2012-10-30 08:00:00-->Other sites visited today: Mayberry | Twitchell Rice | West Pond | DWR Corn
Phenocam link: Searching...
Sherman Island: 2012-10-25 09:20:00 (DOY 299)
Author: Cove Sturtevant
Others: Joe, Sara, Laurie
Summary: Rebuilt fence (electrified!) around power pole. Downloaded data. Did soil respiration, well depth, and moisture point measurements.
| Sherman
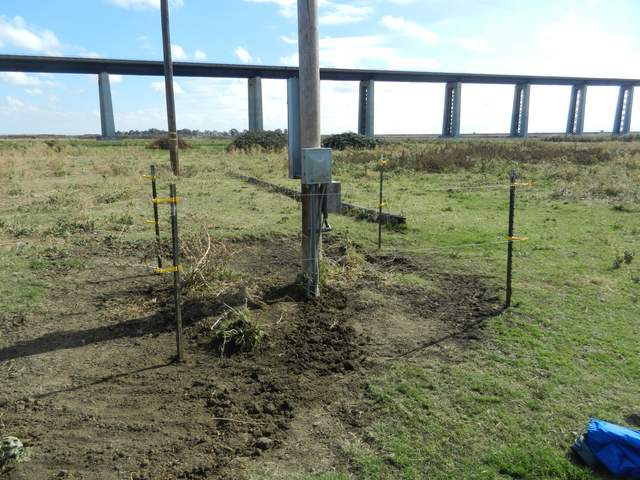
2012-10-25 We arrived about 09:20 PDT. Weather was overcast, calm, about 14°C. The site, although moist from recent rains, continues to look cow trampled with a little dull green. Joe rebuilt the fence around the power pole and electrified it. Cows beware. Joe removed all the old fencing around the power pole and pounded in the four fence posts again a little further out. He ran a copper wire through conduit unground from the existing cow fence to the new fence around the pole. He also replaced the wiring from the fence charger to the existing cow fence and added a new ground post for the charger. I checked the tower, cleaned the instruments, and downloaded the data and autocam pics. Sara and Laurie did soil respiration, well depth, and moisture point. LGR readings: 08:22, 23.16 °C, 133.65 Torr (adjusted to 146.6 Torr), 13.86 us, 10 Hz, 2.05 ppm 7500 readings: CO2: 16.9 mmol m-3 H2O: 560 mmol m-3 P: 102.5 kPa diag: 247 MET and SoilCO2 data streams looked good. I resealed the hole where the ATI cable was fed into the box. We left Joe to finish the new fence while we went to Mayberry. |
1 photos found

20121025SI_PowerPoleFence.jpg ( 2012-10-25 12:24:38 ) Full size: 1920x1440
Rebuilt power pole cow fence with electric wire
7 sets found
No data found for SI_mp.
11 SI_met graphs found
Can't check SI_mixed
2 SI_mixed graphs found
4 SI_flx graphs found
3 SI_soilco2 graphs found
Can't check TWSI_mixed
Can't check SIMBTWEE_met

