Field Notes
<--2012-10-18 12:20:00 | 2012-10-30 10:00:00-->Other sites visited today: Sherman Island | Mayberry | West Pond | DWR Corn
Phenocam link: Searching...
Twitchell Rice: 2012-10-25 13:15:00 (DOY 299)
Author: Cove Sturtevant
Others: Joe, Sara, Laurie
Summary: Parked portable tower truck by the hut. Downloaded data, took LAI, spectral, and clippings. Water pressure sensor moved to Mayberry. Potential error in rain gauge measurements from last week.
| Twitchell
2012-10-25 We arrived at approximately 1:15 PDT. Breezy with just a few clouds, having warmed up to about 18 °C. The rains didn’t seem to change the field much, still mostly yellow with damp soil. We left the portable tower truck outside the hut and handed off the 7700 to the USGS folks. Joe and I checked the tower, cleaned the flux instruments, downloaded the data and camera pics, and also cleaned the radiation sensors. There was a cool spider web halo around the flux instruments that Joe got a picture of (hopefully it came out). Sara and Laurie took clippings, LAI, and spectral. Current 7500 readings: CO2 = 400 ppm H2O = 500 mmol m-3 agc = 43.8 7700 readings: CH4 = 1.9 ppm RSSI = 38 (bumped to 72 after cleaning) MET values looked fine. We pulled the water pressure sensor since it was reading 0, and installed it at Mayberry later. The pressure probe was burried in about 15cm of mud at the bottom of the well. There was no water in the well. The rain gauge was full of water due to a wad of bird poop at the bottom. Joe declogged it, allowing the water to run through the sensor. |
2 photos found

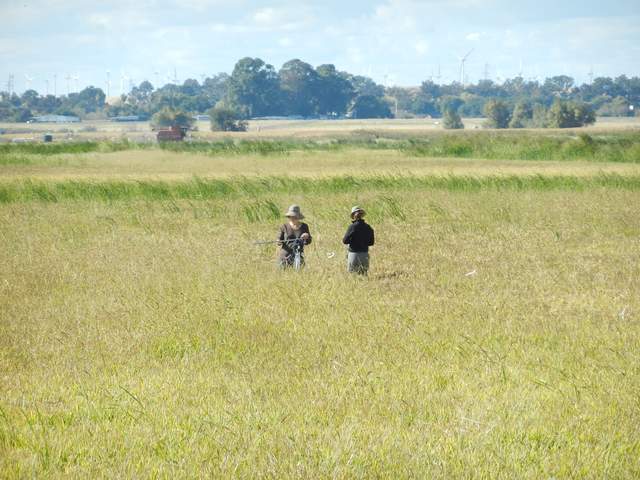
20121025TW_SaraLaurie.jpg ( 2012-10-25 13:56:37 ) Full size: 1920x1440
Sara and Laurie woking on spectral measurements

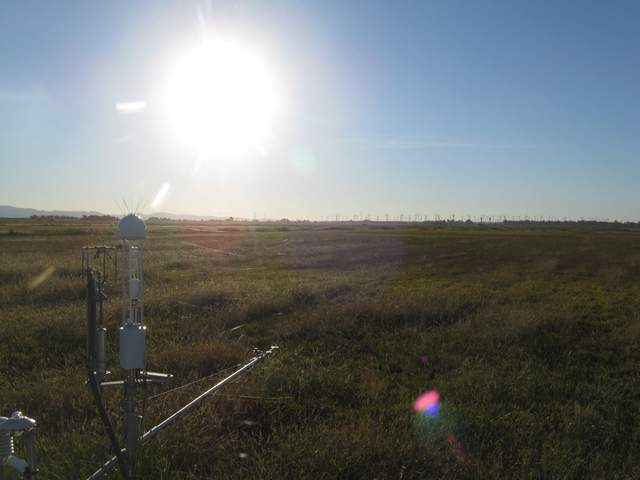
TW_autocam_20121026_1615.jpg ( 2012-10-26 16:15:02 ) Full size: 1920x1440
Spider webs on eddy sensors
6 sets found
12 TW_met graphs found
5 TW_flux graphs found
Can't check TWSI_mixed
Can't check SIMBTWEE_met
1 TW_cam graphs found
Can't check TATWBABCSB_cam

