
Field Notes
<--2012-10-18 13:00:00 | 2012-10-30 11:15:00-->Other sites visited today: Sherman Island | Mayberry | Twitchell Rice | DWR Corn
Phenocam link: Searching...
West Pond: 2012-10-25 14:10:00 (DOY 299)
Author: Cove Sturtevant
Others: Joe, Sara, Laurie
Summary: Water level higher and inlets running. Downloaded data, took water samples.
| West Pond
2012-10-25 We arrived about 14:10 PDT. Warm, breezy, few clouds. The water level beneath the tower was the highest it’s been in a few weeks and the inlets were running at full flow. Sara and Laurie took water samples while Joe and I checked the tower and downloaded data and camera pics, also cleaning lots of spider webs from the sensors. We downloaded ATI the data from the CF card with Card Convert, wiped the card and reinserted in the the CR1000. We used the white field netbook because we only had one good battery (see TW notes). Current 7500 readings: CO2 = 397 ppm H2O = 470 mmol m-3 agc = 43.8 7700 readings: CH4 = 1.87 ppm RSSI = 52 (bumped to 82 after cleaning) MET looked good, upper DO at 4.5, lower DO at 3.3 |
2 photos found
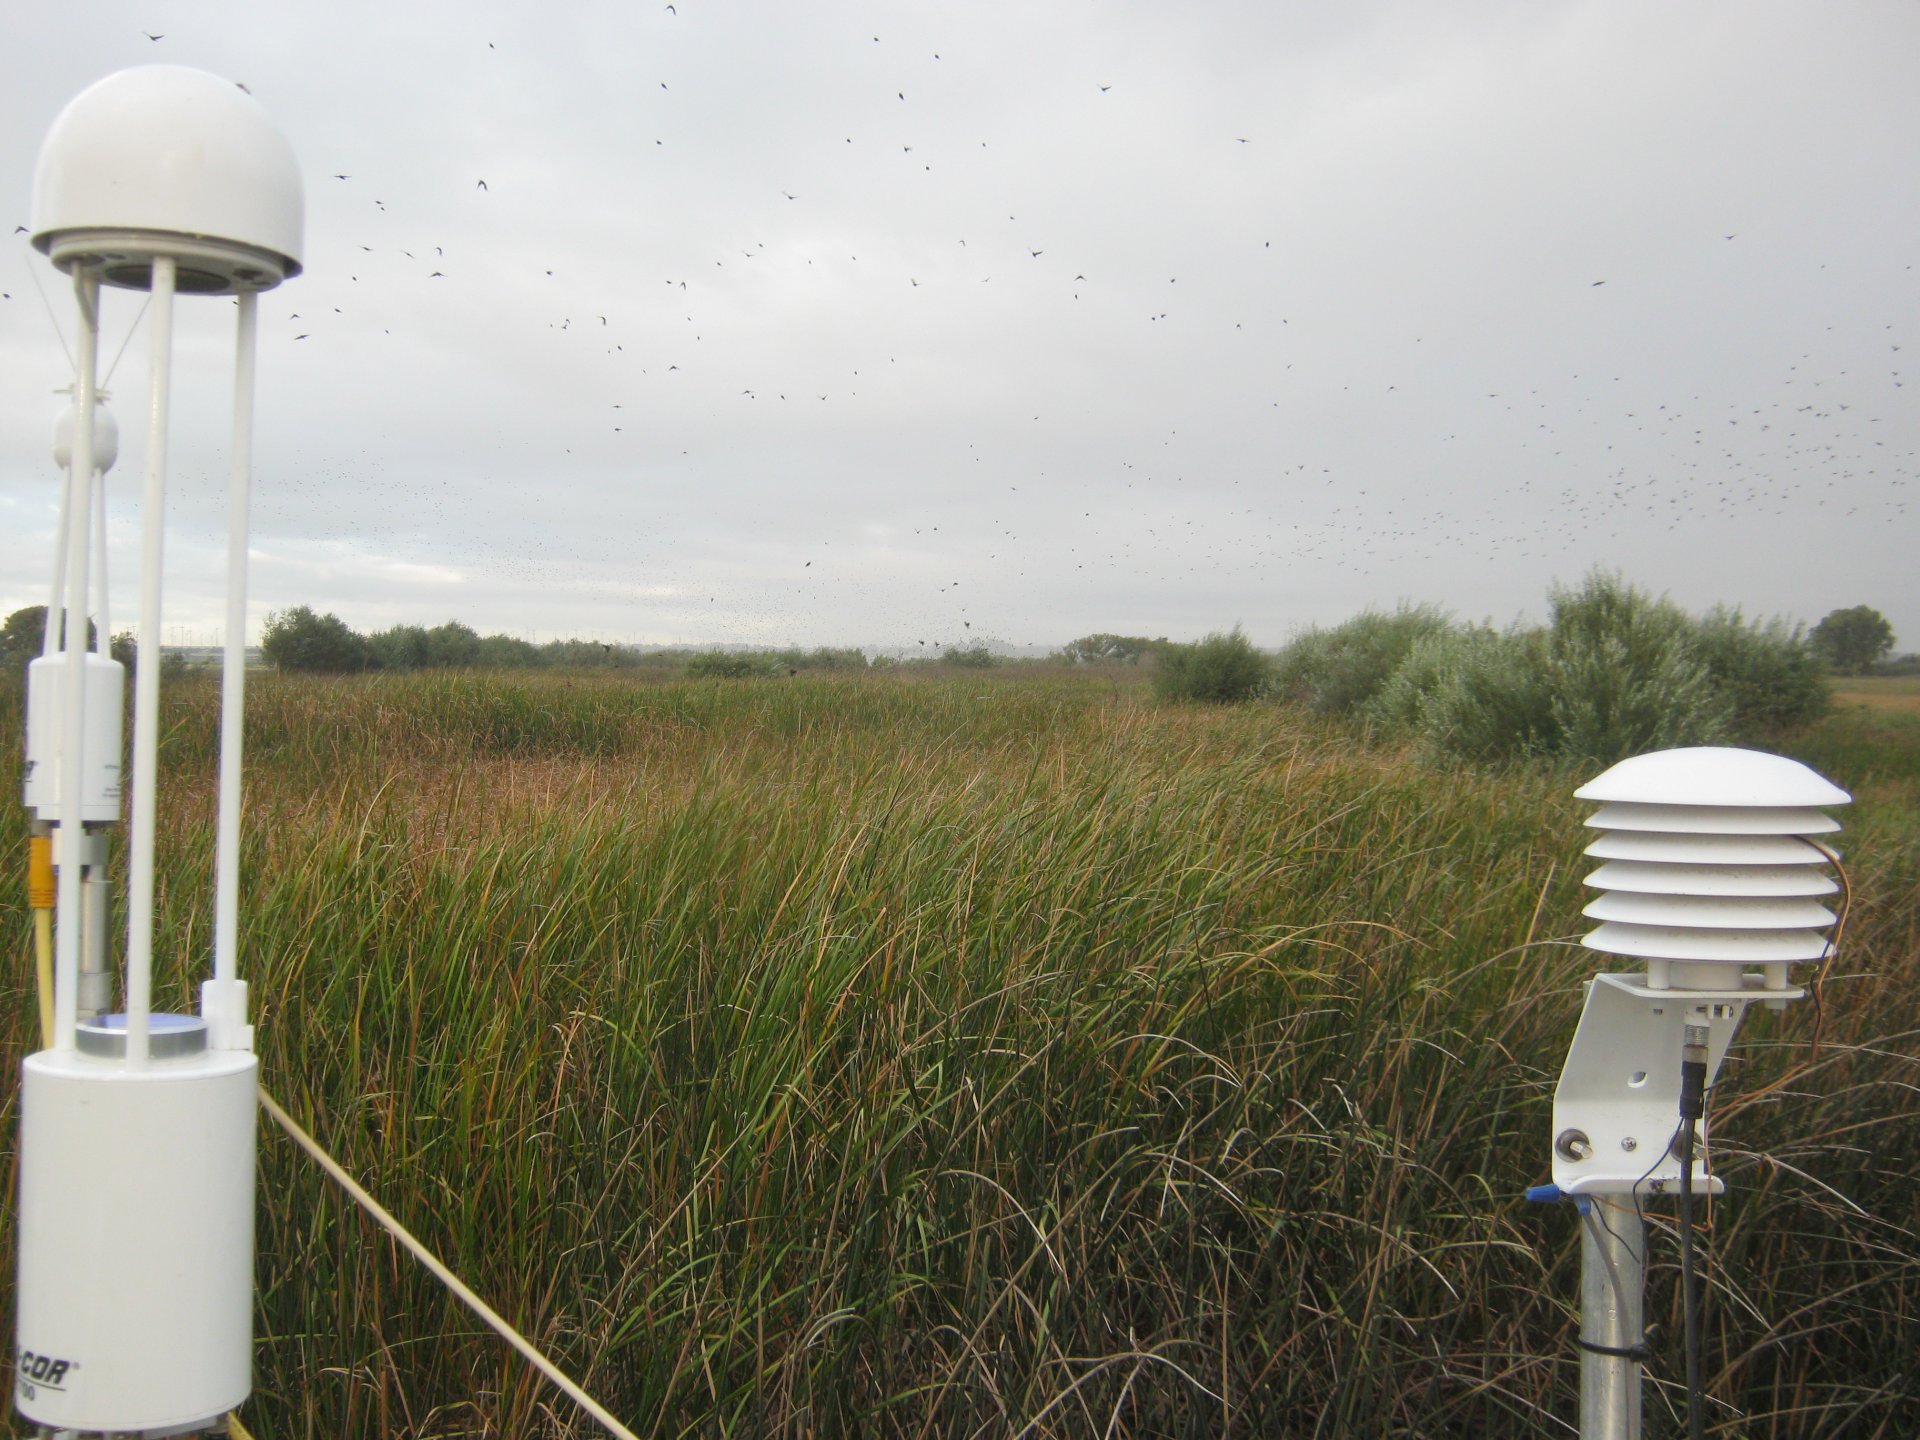
WP_autocam_20121024_0715.jpg ( 2012-10-24 07:15:02 ) Full size: 1920x1440
Lots of birds
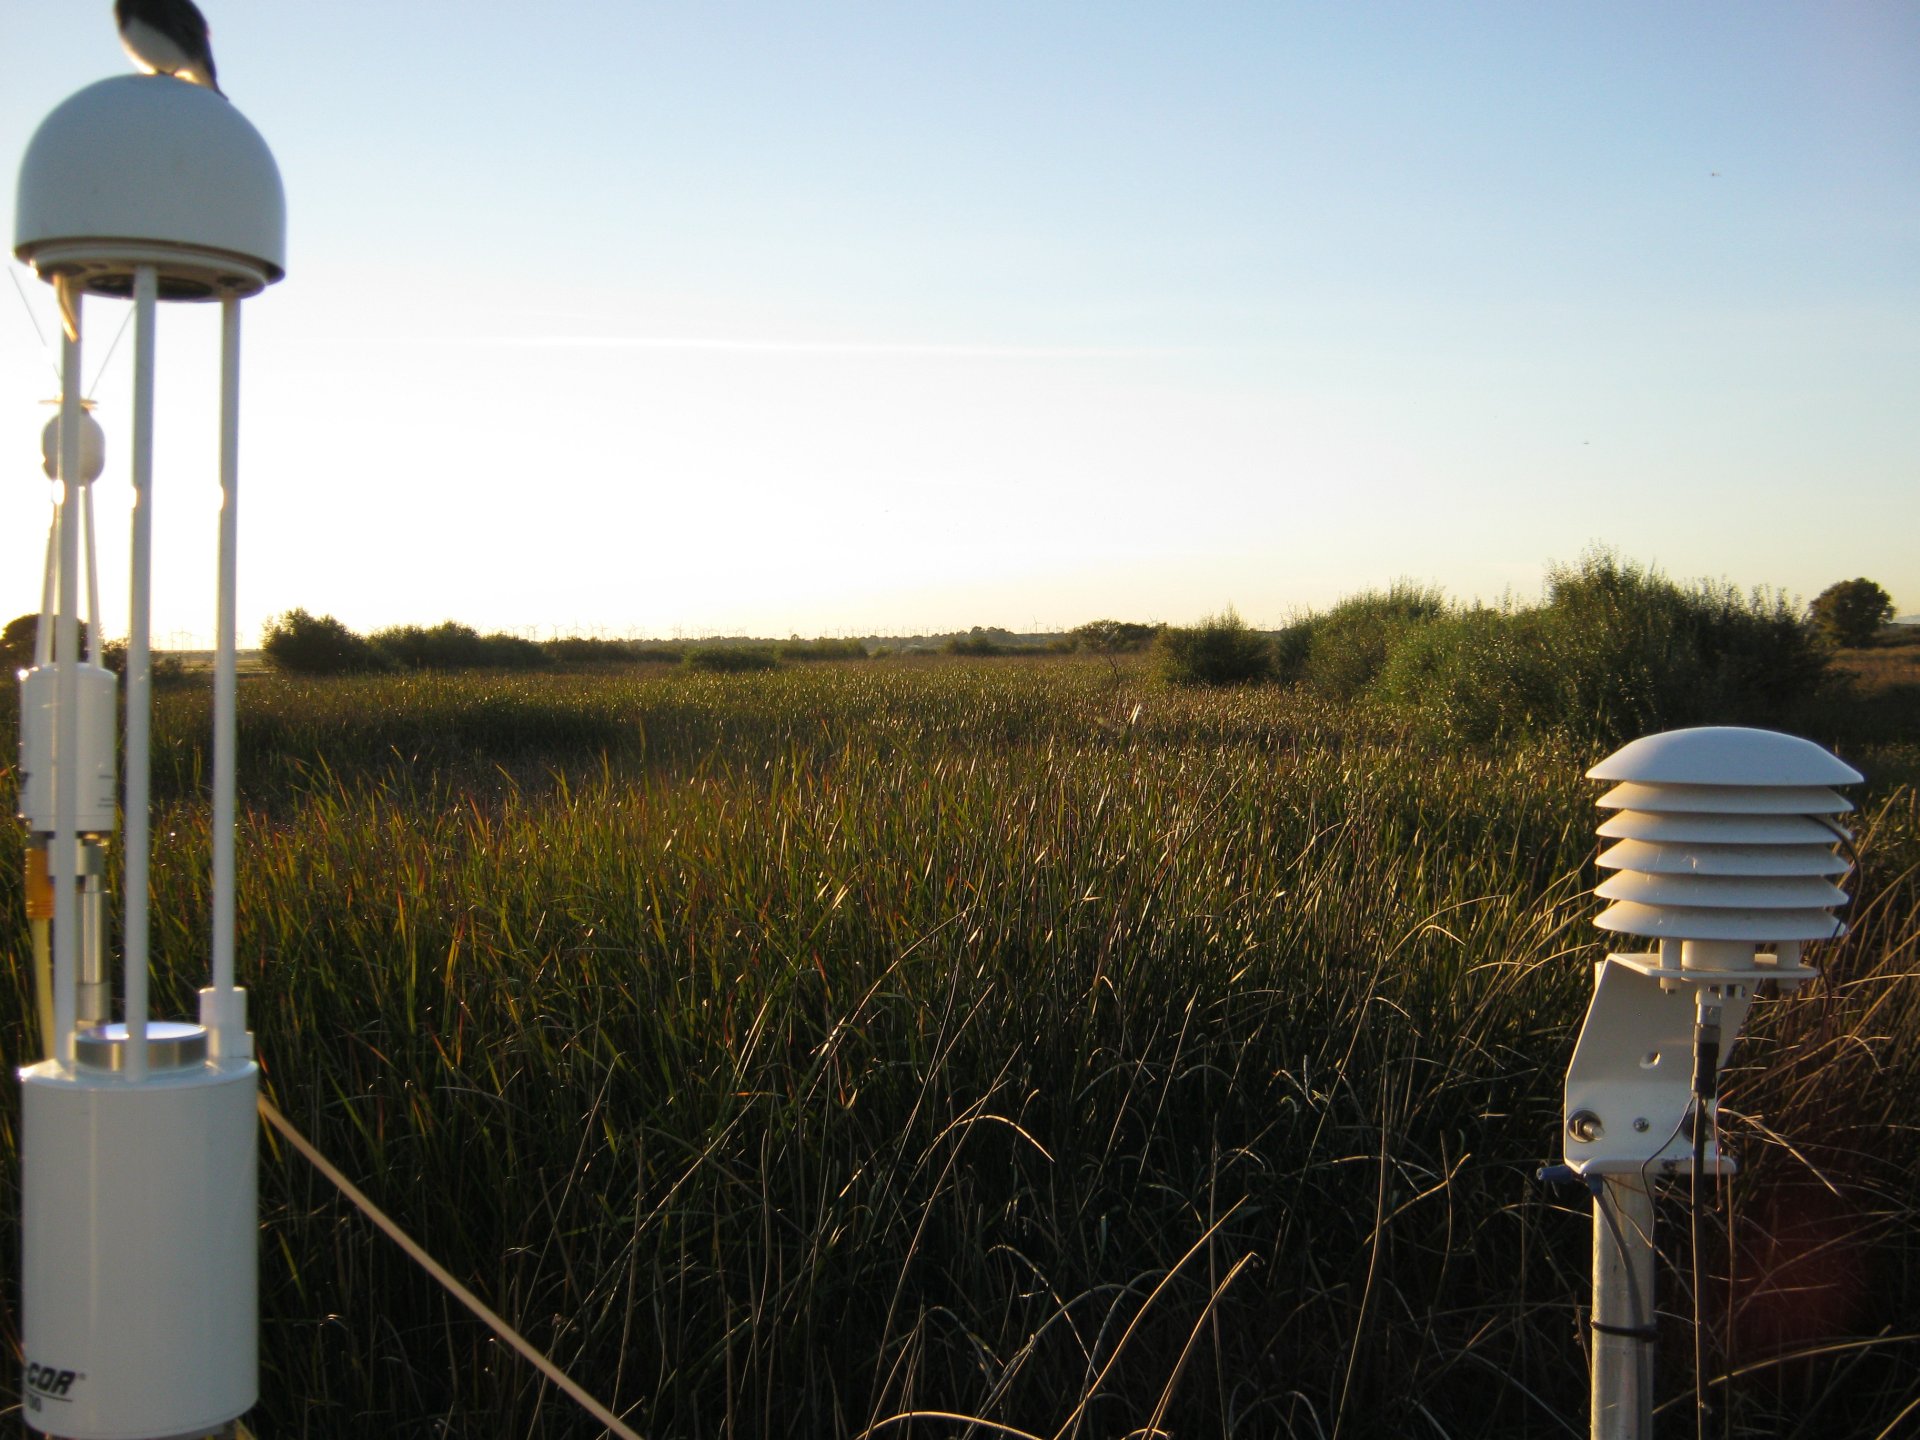
WP_autocam_20121026_1645.jpg ( 2012-10-26 16:45:02 ) Full size: 1920x1440
Small bird on 7700 hat
8 sets found
Can't check WP_DO
1 WP_DO graphs found
14 WP_met graphs found
5 WP_flux graphs found
Can't check MBWPEESWGT_mixed
Can't check MBEEWPSWEPGT_cam
Can't check MBSWEEWPBCBA
1 WP_processed graphs found
No data found for WP_arable.