Field Notes
<--2011-04-15 00:00:00 | 2011-04-22 00:00:00-->Other sites visited today: Vaira | Mayberry | Tonzi
Phenocam link: Searching...
Tonzi: 2011-04-15 12:00:00 (DOY 105)
Author: Joe Verfaillie
Others: Siyan (Sunny, Alex)
Summary: Serviced z-cams - advanced image collection one hour, Fixed unsetup DAC channels on tower LI-7500, changed co2 profile filters.
| Tonzi
4/15/2011 I arrived about noon time PDT with Siyan (and Sunny and Alex). It was warm and sunny with some high thin clouds and a light breeze from the west. The ground is much drier but Tonzi’s pond is still full and the wells are still high. There are lots of flowers, but maybe not as much as last year, though it may still be early. The trees have put on lots of leaves, but maybe not as much as Vaira. Maybe about 70% complete. I serviced the z-cams. All seemed well. I advanced the time on the cameras for the lengthening days. For z-cam one and two I changed the CR10X program from 900 and 1021 (3pm and 5pm) PST to 960 and 1081 (4pm and 6pm) PST. For z-cam three I changed the CR200 clock from 3:18 to 2:15 which makes the image start an hour later. The cameras time tag the images with their internal clocks. Siyan noticed that the LI-7500 channels on the tower were both zero and I discovered that the DAC channels on the LI-7500 had not been setup. This is the LI-7500 that was recently returned from repair at Licor and probably had been reset to default settings. Two weeks of LI-7500 data lost from the tower top. I changed the filters in the CO2 profile inlets and replaced two of the funnels. The filter at top inlet was really dirty but the others were okay. I left wrenches, spare filters and funnels in the computer box. Tram was running. Sensors at the tower top were okay. I cleaned a little bird poop off of the pyranometer. |
Field Data
No tank data
Well Depth
| Date | Location | Depth (feet) |
|---|---|---|
| 2011-04-15 | TZ_floor | 10.09 |
| 2011-04-15 | TZ_road | 19.4 |
| 2011-04-15 | TZ_tower | 13.9 |
No TZ Moisture Point data found
No VR Moisture Point data found
No TZ grass heigth found
No VR grass heigth found
No TZ Tree DBH found
Water Potential - mode: raw
| Time | Species | Tree | readings (bar) | ||
|---|---|---|---|---|---|
| 2011-04-15 12:04:00 | OAK | UNKNOWN | -10.6 | -11 | -15 |
| 2011-04-15 12:04:00 | PINE | UNKNOWN | -16.5 | -17 | -22 |
No TZ Grass Biomass data found
No TZ OakLeaves Biomass data found
No TZ PineNeedles Biomass data found
10 photos found
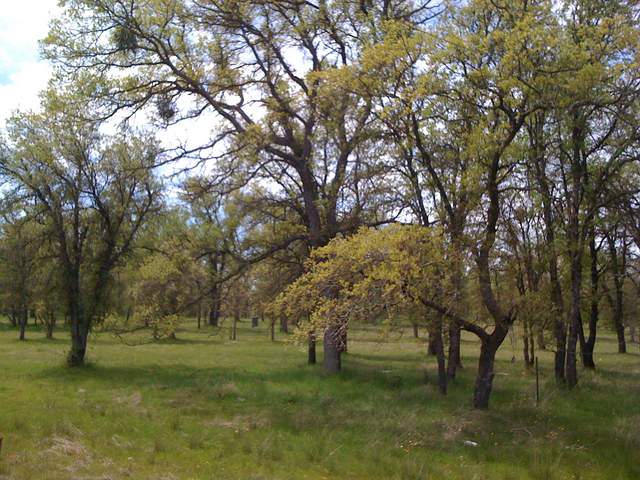
tz_7696.jpg ( 2011-04-15 12:46:17 ) Full size: 1600x1200
Green grass and oak trees with fresh leaves
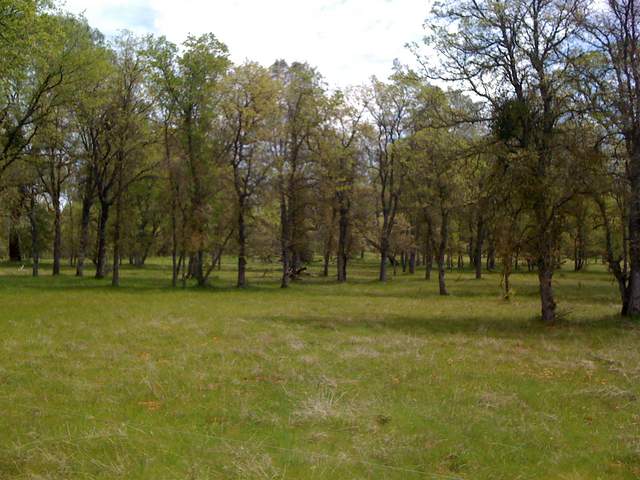
tz_7695.jpg ( 2011-04-15 12:46:10 ) Full size: 1600x1200
Green grass and oaks with new leaves
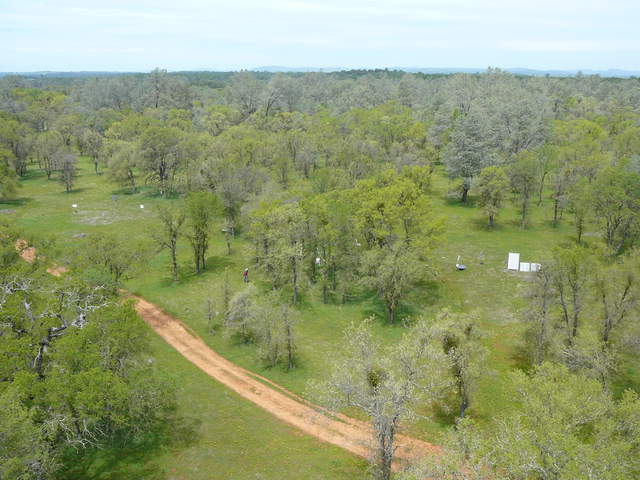
20110415TZ_ViewOfFloor.jpg ( 2011-04-15 11:49:25 ) Full size: 2560x1920
New leaves and green grass from the tower top
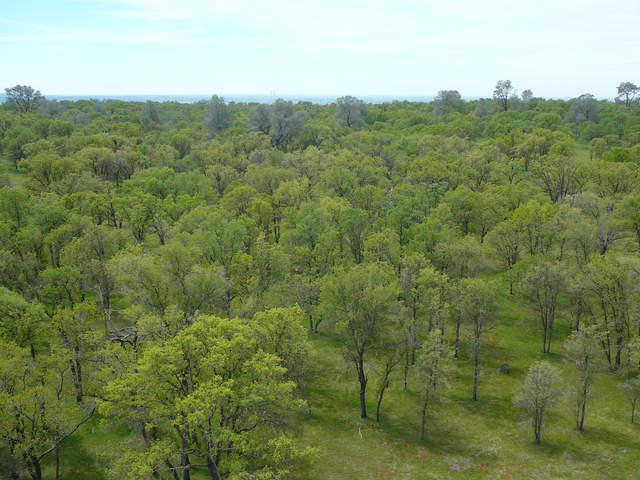
20110415TZ_ViewToRanchoSeco.jpg ( 2011-04-15 11:50:12 ) Full size: 2560x1920
View of pretty new green leave on the oaks and green grass from tower top
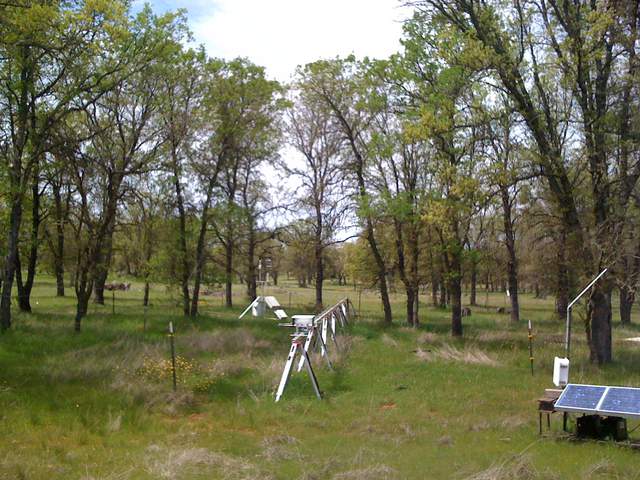
tz_7697.jpg ( 2011-04-15 12:46:23 ) Full size: 1600x1200
Green grass and oak trees with fresh leaves at the tram site
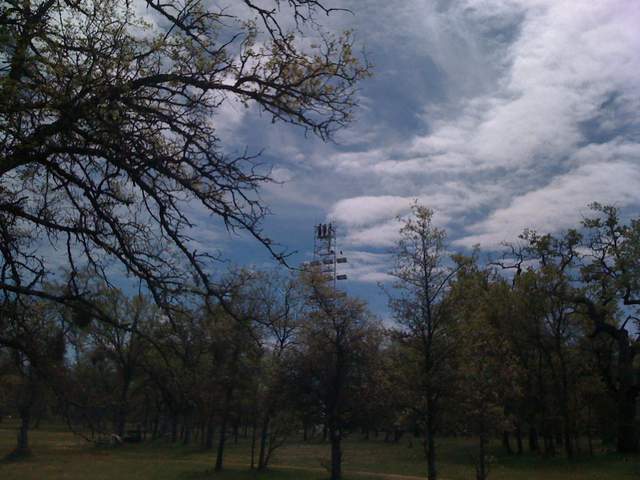
tz_7698.jpg ( 2011-04-15 13:00:14 ) Full size: 1600x1200
Tower top peeking above the tree in a cloudy sky
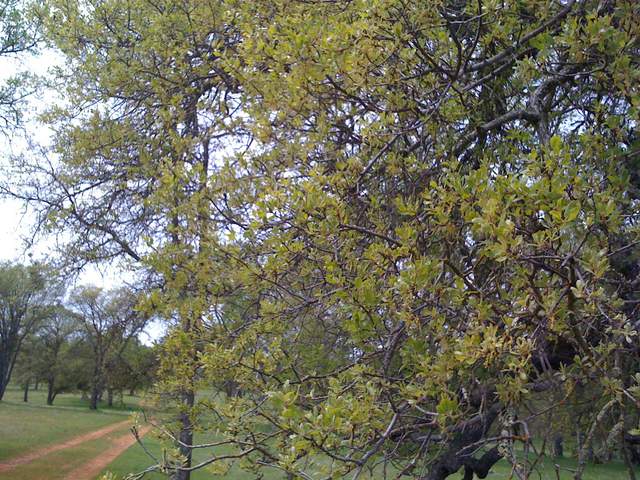
tz_7700.jpg ( 2011-04-15 13:09:25 ) Full size: 1600x1200
Fresh green leaves on oak branches
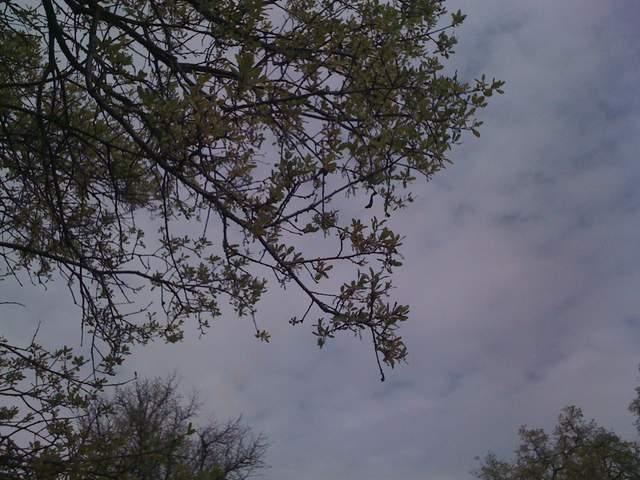
tz_7701.jpg ( 2011-04-15 13:09:38 ) Full size: 1600x1200
View of sky and oak boughs
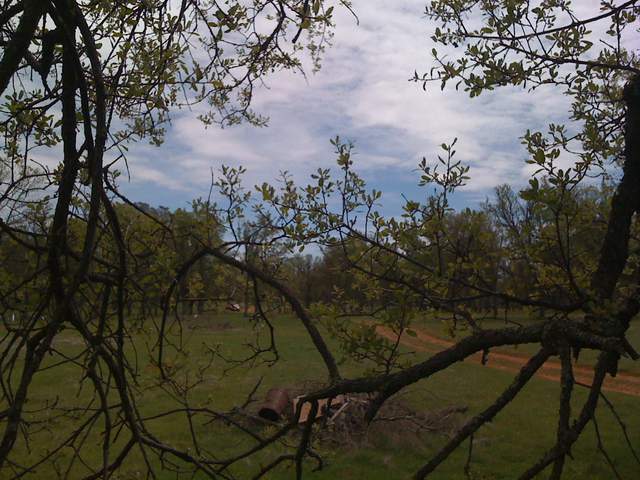
tz_7702.jpg ( 2011-04-15 13:11:15 ) Full size: 1600x1200
View through oak branches of the savanna
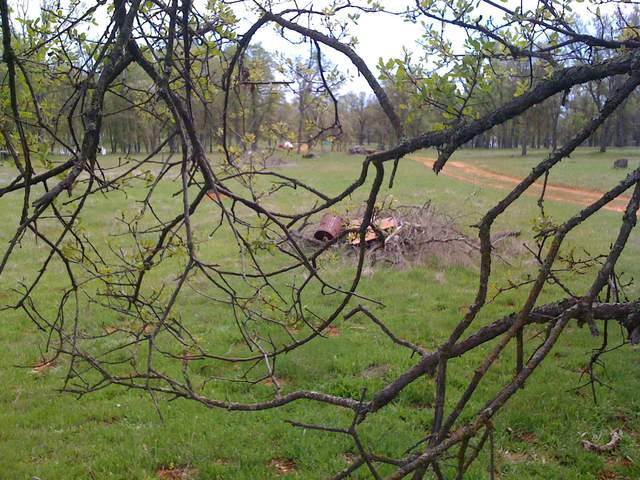
tz_7703.jpg ( 2011-04-15 13:11:24 ) Full size: 1600x1200
Green grass behind dead branches
16 sets found
No data found for TZ_Fenergy.
11 TZ_tmet graphs found
11 TZ_soilco2 graphs found
Can't check TZ_mixed
3 TZ_mixed graphs found
1 TZ_fflux graphs found
8 TZ_fmet graphs found
1 TZ_tram graphs found
3 TZ_co2prof graphs found
No data found for TZ_irt.
No data found for TZ_windprof.
1 TZ_tflux graphs found
2 TZ_sm graphs found
Can't check TZ_met
1 TZ_met graphs found
Can't check TZVR_mixed
No data found for TZ_osu.
No data found for TZ_fd.
Tonzi Z-cam data

