Field Notes
<--2011-03-30 10:45:00 | 2011-04-15 12:00:00-->Other sites visited today: Tonzi | Vaira | Mayberry
Phenocam link: Searching...
Tonzi: 2011-04-15 00:00:00 (DOY 105)
Author: Siyan Ma
Others: Joe
Summary: Tonzi: 100% oak leaf out
| Tonzi: 100% oak leaf out, yellow and white flowers
Vaira: grass green, purple flowers Vaira: • Joe checked computer and downloaded data. • I cleaned the surface of the radiation sensors and checked rain gauge. • Soil moisture measured, but the two newly installed profile probes still gave lower values of the top layer. Should we reinstall them? • Took grass spectrum reflectance. Tower: • I checked computer and downloaded data. • Readings of Tower Li-7500’s CO2 and H2O channel were almost zero. Joe found out there was no setting of the range, and he fixed the problem. The mistake should be avoidable. • Calibrated the CO2 profile system in the field. Floor: • I checked computer and downloaded data. • Joe made efforts to clarify Tonzi met file names on 3/30/2011. When I try to process them, I realize such changes may cause other confuse and waste time. For example, the old name for Tonzi soil met data is "tz2_*.10X", and now it is changed as "CR10X2_soilt_*.10X". I think we should keep the original "tz2", such as "tz2_soil_*.10X". I have talked to Joe about this idea, and he agreed with it. Other data collection: soil moisture tonzi, 7931AFE, 402165, 574B4B, 402FF3, 574632, 7A432E, 7A3C6E, 7A3B40, 7A4AAA 4/15/2011, 105, 0-15, 37.3, 23.6, 37.0, 21.9, 39.9, 17.1, 19.1, 19.4, 16.2 15-30, 36.8, 33.9, 33.4, 27.3, 29.2, 23.7, 27.1, 27.4, 18.5 30-45, 42.7, 41.9, 39.8, 37.1, 45.2, 26.5, 26.2, 31.0, 31.5 45-60, 39.7, 61.6, 65.0, 47.7, 42.3, 32.5, 38.0, 47.1, 27.6 ,A6D882B, A3D04E8, A6D72F5, 0-15, 21.2, 15.0, 29.5, 15-30, 22.8, 10.6, 40.1, 30-45, 33.2, 29.6, 36.2 45-60, 44.0, 47.1, 41.4 vaira, 57318a, 7933dee, 00000128B97F3, 00000128B8072, 00000128BDDE8, , , 0-15, broken, 15.2, 19.85, 6.5, 4.15, 15-30, broken, 23.9, 24, 10.1, 6.85, 30-45, broken, 31.3, 9.25, 18.55, 22.5, 45-60, broken, 32.7, 24.65, 18.2, 26.55, dendrometer 245, 16.9 250, 11.1 102, 3.9 79, 21 72, 16 2, 14.7 3, 9.5 6, 18.9 4, 13.8 7, 10.4 8, 5.1 1, 8.4 midday leaf water potential: oak - groundwater: wells and datalogger – shorten the cable of the datalogger to make sure the sensor is no deeper than 15 ft as Gretchen suggested. Road: 19.40 ft; floor: 10.09 ft; tower: 13.90 ft. |
Field Data
No tank data
Well Depth
| Date | Location | Depth (feet) |
|---|---|---|
| 2011-04-15 | TZ_floor | 10.09 |
| 2011-04-15 | TZ_road | 19.4 |
| 2011-04-15 | TZ_tower | 13.9 |
No TZ Moisture Point data found
No VR Moisture Point data found
No TZ grass heigth found
No VR grass heigth found
No TZ Tree DBH found
Water Potential - mode: raw
| Time | Species | Tree | readings (bar) | ||
|---|---|---|---|---|---|
| 2011-04-15 12:04:00 | OAK | UNKNOWN | -10.6 | -11 | -15 |
| 2011-04-15 12:04:00 | PINE | UNKNOWN | -16.5 | -17 | -22 |
No TZ Grass Biomass data found
No TZ OakLeaves Biomass data found
No TZ PineNeedles Biomass data found
10 photos found
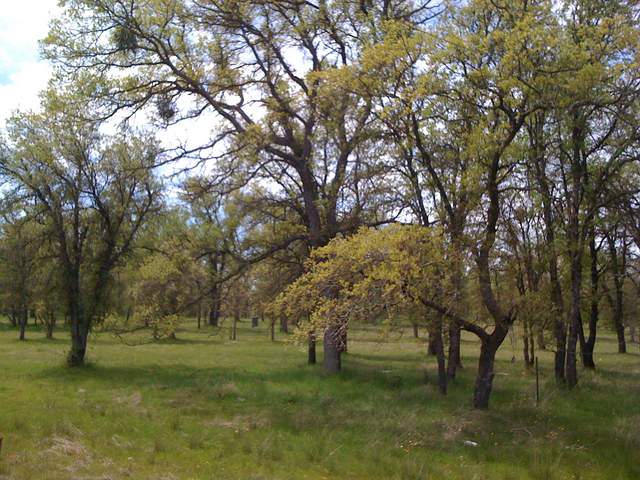
tz_7696.jpg ( 2011-04-15 12:46:17 ) Full size: 1600x1200
Green grass and oak trees with fresh leaves
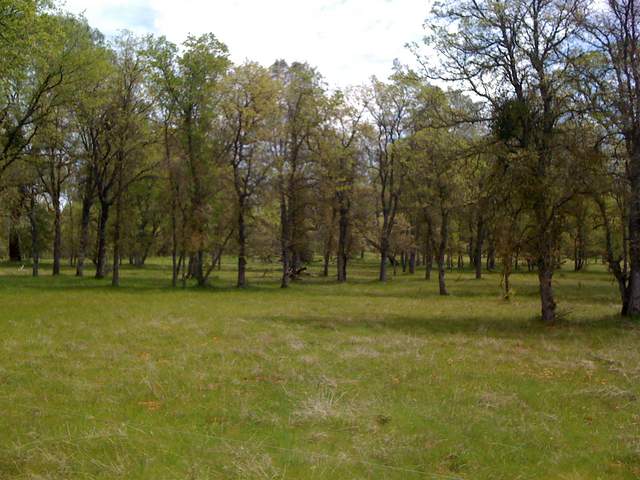
tz_7695.jpg ( 2011-04-15 12:46:10 ) Full size: 1600x1200
Green grass and oaks with new leaves
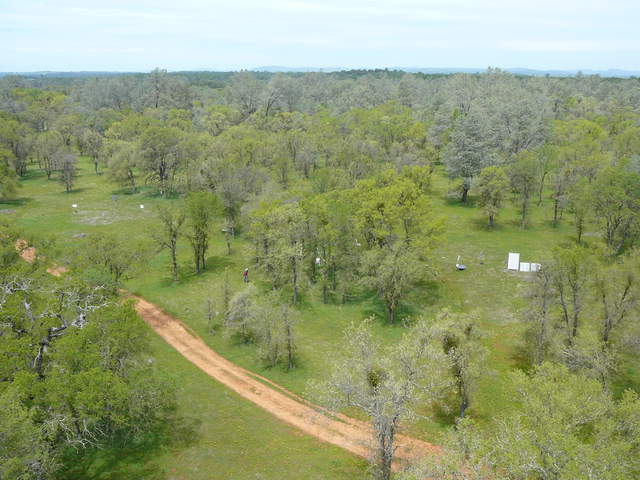
20110415TZ_ViewOfFloor.jpg ( 2011-04-15 11:49:25 ) Full size: 2560x1920
New leaves and green grass from the tower top
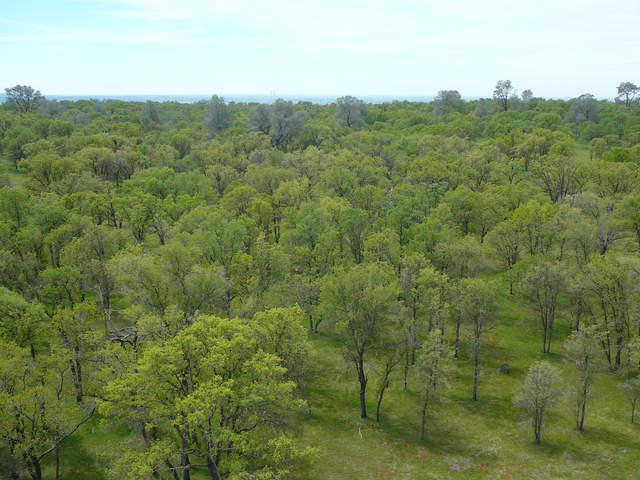
20110415TZ_ViewToRanchoSeco.jpg ( 2011-04-15 11:50:12 ) Full size: 2560x1920
View of pretty new green leave on the oaks and green grass from tower top
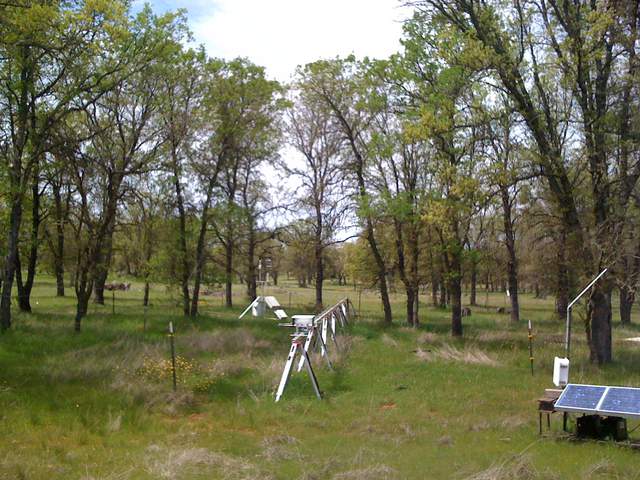
tz_7697.jpg ( 2011-04-15 12:46:23 ) Full size: 1600x1200
Green grass and oak trees with fresh leaves at the tram site
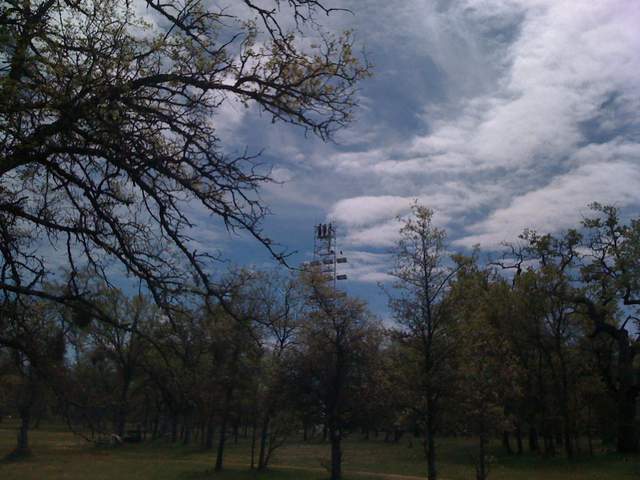
tz_7698.jpg ( 2011-04-15 13:00:14 ) Full size: 1600x1200
Tower top peeking above the tree in a cloudy sky
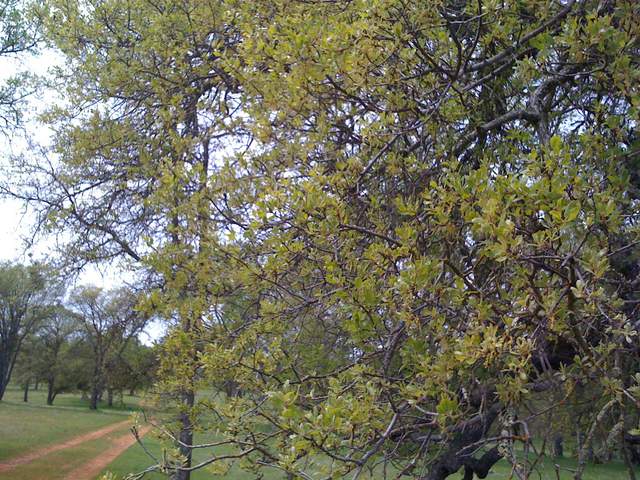
tz_7700.jpg ( 2011-04-15 13:09:25 ) Full size: 1600x1200
Fresh green leaves on oak branches
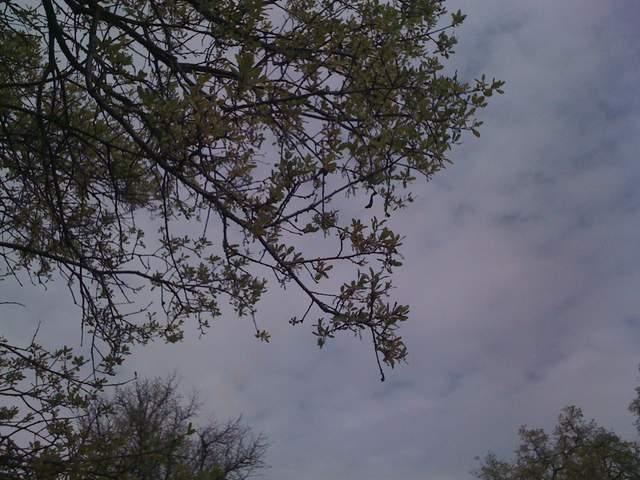
tz_7701.jpg ( 2011-04-15 13:09:38 ) Full size: 1600x1200
View of sky and oak boughs
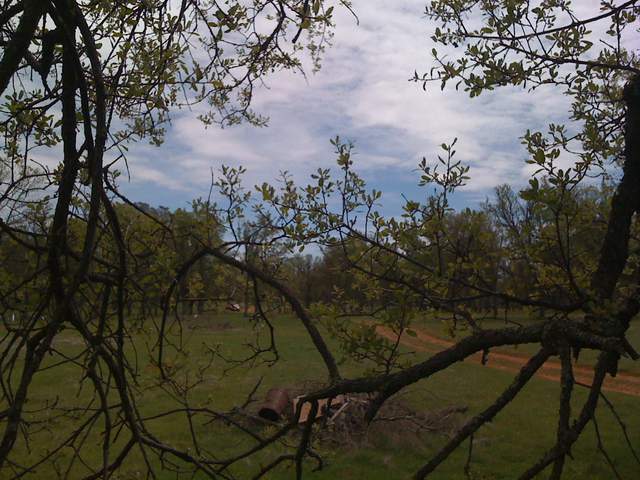
tz_7702.jpg ( 2011-04-15 13:11:15 ) Full size: 1600x1200
View through oak branches of the savanna
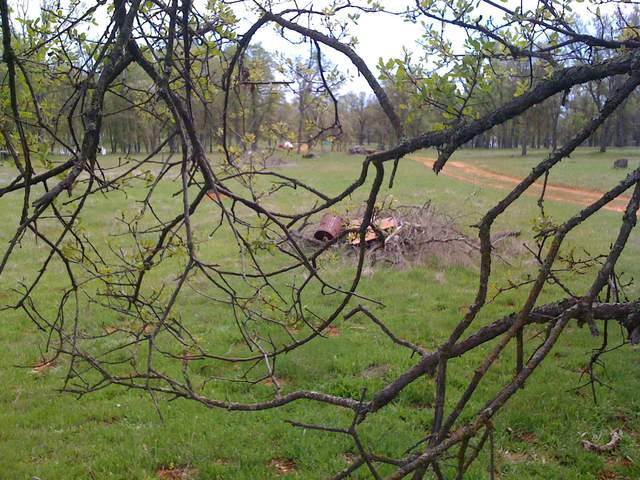
tz_7703.jpg ( 2011-04-15 13:11:24 ) Full size: 1600x1200
Green grass behind dead branches
16 sets found
No data found for TZ_Fenergy.
11 TZ_tmet graphs found
11 TZ_soilco2 graphs found
Can't check TZ_mixed
3 TZ_mixed graphs found
1 TZ_fflux graphs found
8 TZ_fmet graphs found
1 TZ_tram graphs found
3 TZ_co2prof graphs found
No data found for TZ_irt.
No data found for TZ_windprof.
1 TZ_tflux graphs found
2 TZ_sm graphs found
Can't check TZ_met
1 TZ_met graphs found
Can't check TZVR_mixed
No data found for TZ_osu.
No data found for TZ_fd.
Tonzi Z-cam data

