
Field Notes
<--2024-04-16 10:00:00 | 2024-05-16 08:15:00-->Other sites visited today: West Pond | East End | Bouldin Corn | Bouldin Alfalfa
Phenocam link: Searching...
Hill Slough: 2024-05-01 14:45:00 (DOY 122)
Author: Daphne Szutu
Others: Joe
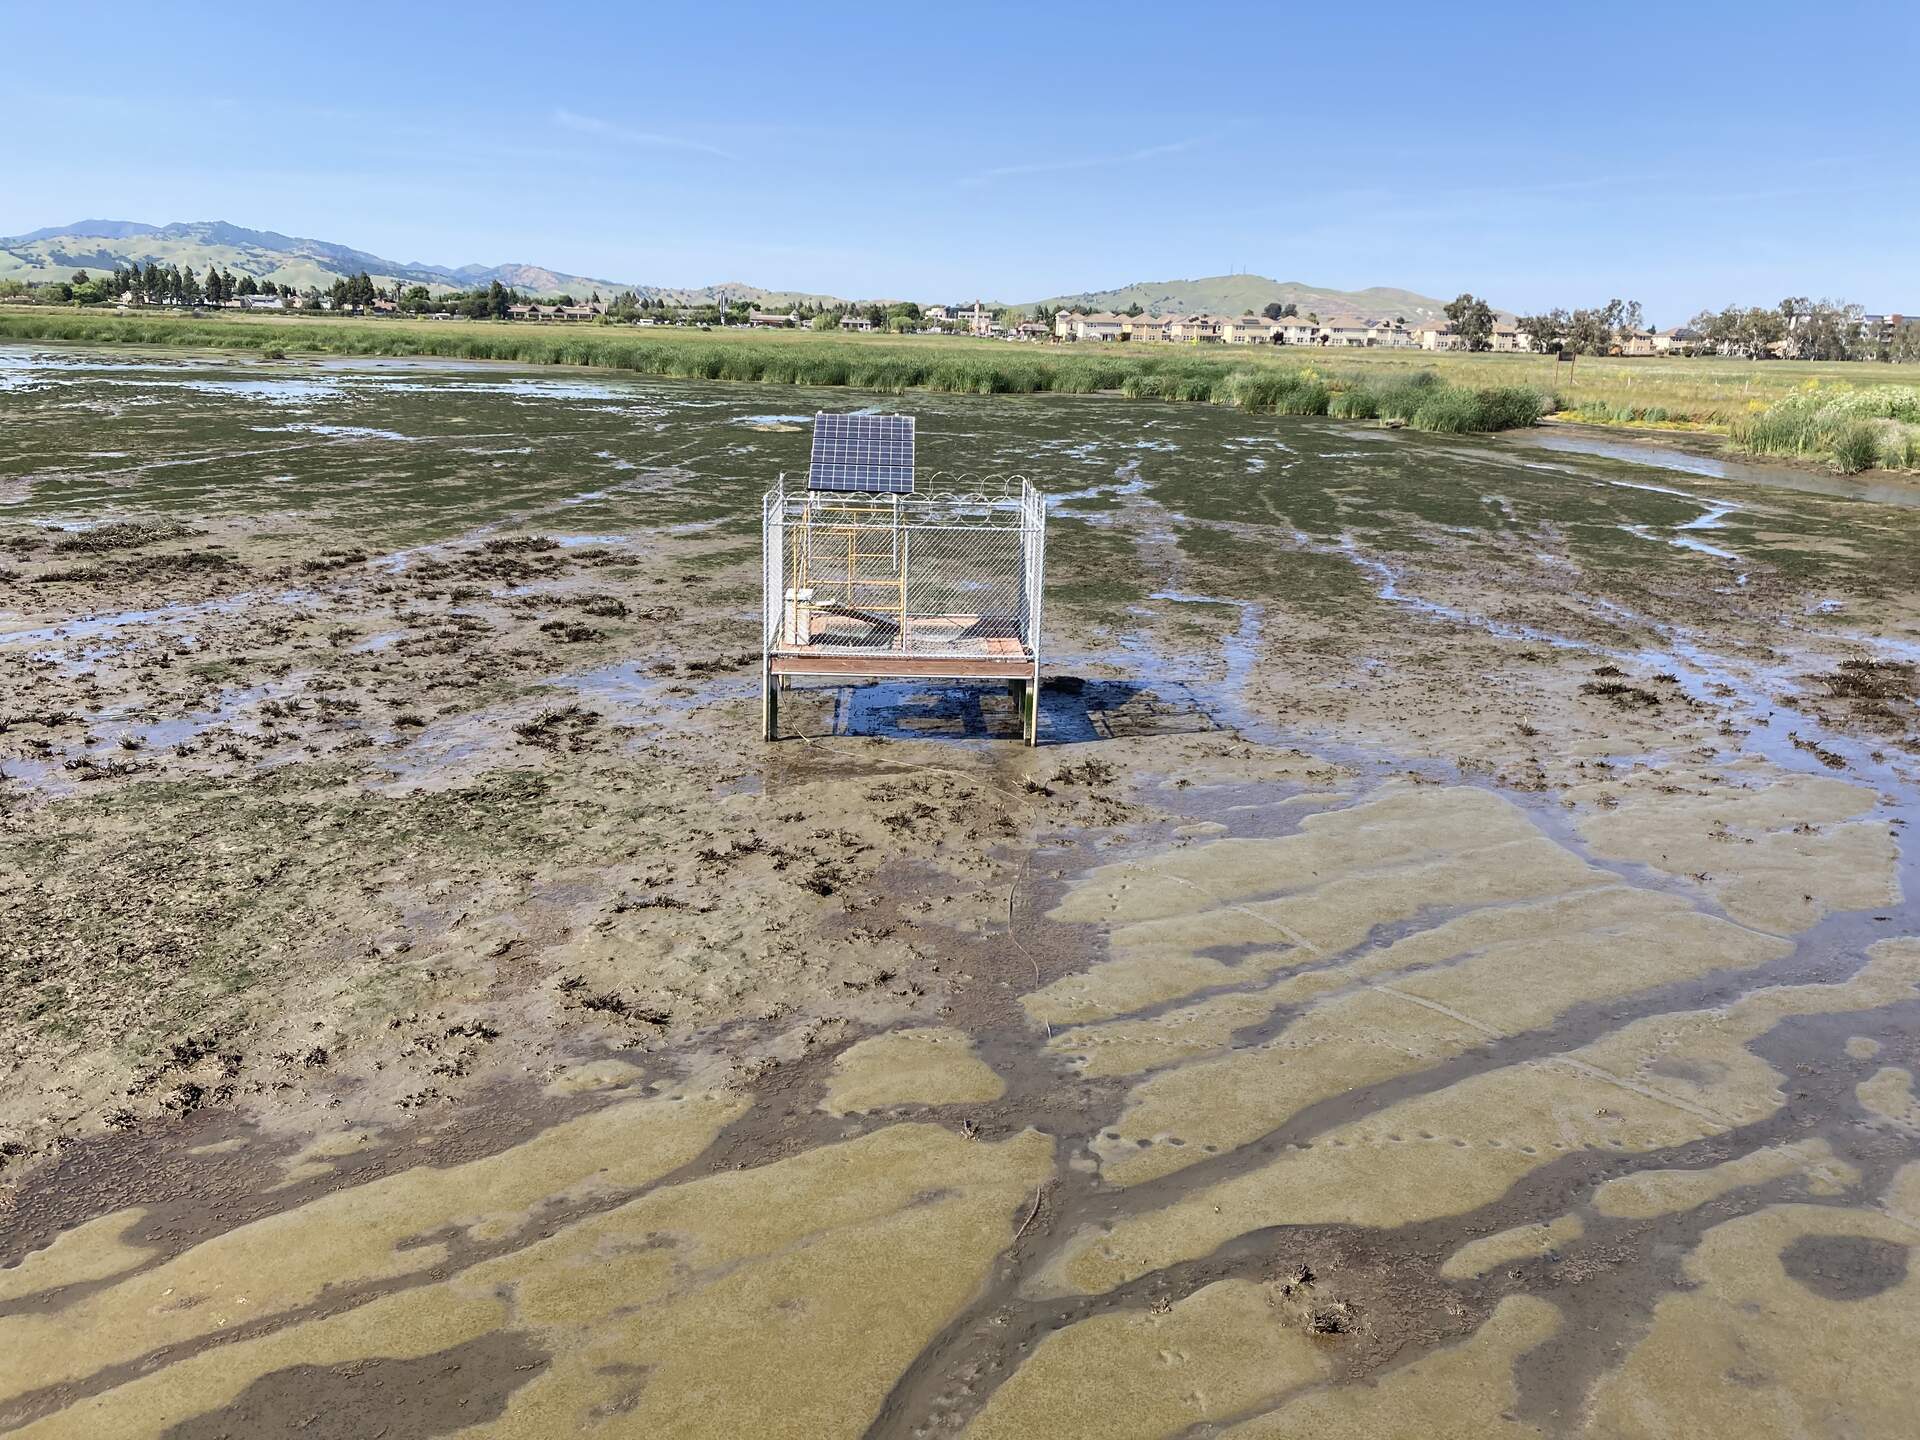
Summary: Super low tide, all channel sensors were out of the water, actively bubbling water/mud
| 2024-05-01 Hill Slough Joe and I arrived at 14:45 PST (15:45 PDT). It was a warm day but surprisingly not as windy as the other sites of the day. The water level was super low. The mud level was 3.3 feet on the channel staff gauge, and the water level was below that by at least 30cm. All of the water sensors were above the water by about 5cm: the EXO, miniDOT, and eosGP. We still need to replace the CTD here. We have one in the lab with a shortened cable. There was maybe about 5cm of muddy water in the channel. We could see and hear a lot of bubbles coming up through the mud and through the shallow water of the channel. It sounded like a gently simmering pot of water, or like the burbling of one of those geothermal mud pits. There were lot of interesting animal tracks in the mud. The upper boardwalk is starting to sound creaky and should be replaced. I downloaded met, cam, and USB GHG data. Joe cleaned flux and rad sensors and reported lots of spiderwebs everywhere. The wash reservoir was 2/3 full; I refilled it. The 7500 read: 420ppm CO2, 153 mmol/m3 H2O, 27.3C, 101.4kPa, 96SS -- 98 after cleaning The 7700 read: 2.0ppm CH4, 39RSSI – 88 after cleaning Joe took a porewater sample. There was lots of bubbles in the sample, so he had to draw the plunger all the way out, closed the valve and removed the syringe to push out the headspace, then attached the syringe again and pulled the plunger again to get enough liquid for the sample. There was no surface water at the tower, but we measured the channel water on the way out. The channel number jumped around a lot. Sample, Temperature-compensated conductivity, Water temperature, Notes Pore water, 5.59mS, 24.8C Surface, 4.2mS, 29.9C, sampled channel and reading jumped a lot between 3.8-4.5mS We left at 15:15 PST (16:15 PDT). |
4 photos found
20240501HS_GreenMat.jpg ( 2024-05-01 16:03:34 ) Full size: 1920x1440
A green mat of algae on the mud flat to the north

20240501HS_DryWaterSensors.jpg ( 2024-05-01 15:48:10 ) Full size: 1920x1440
The water sensors are in the air at low tide
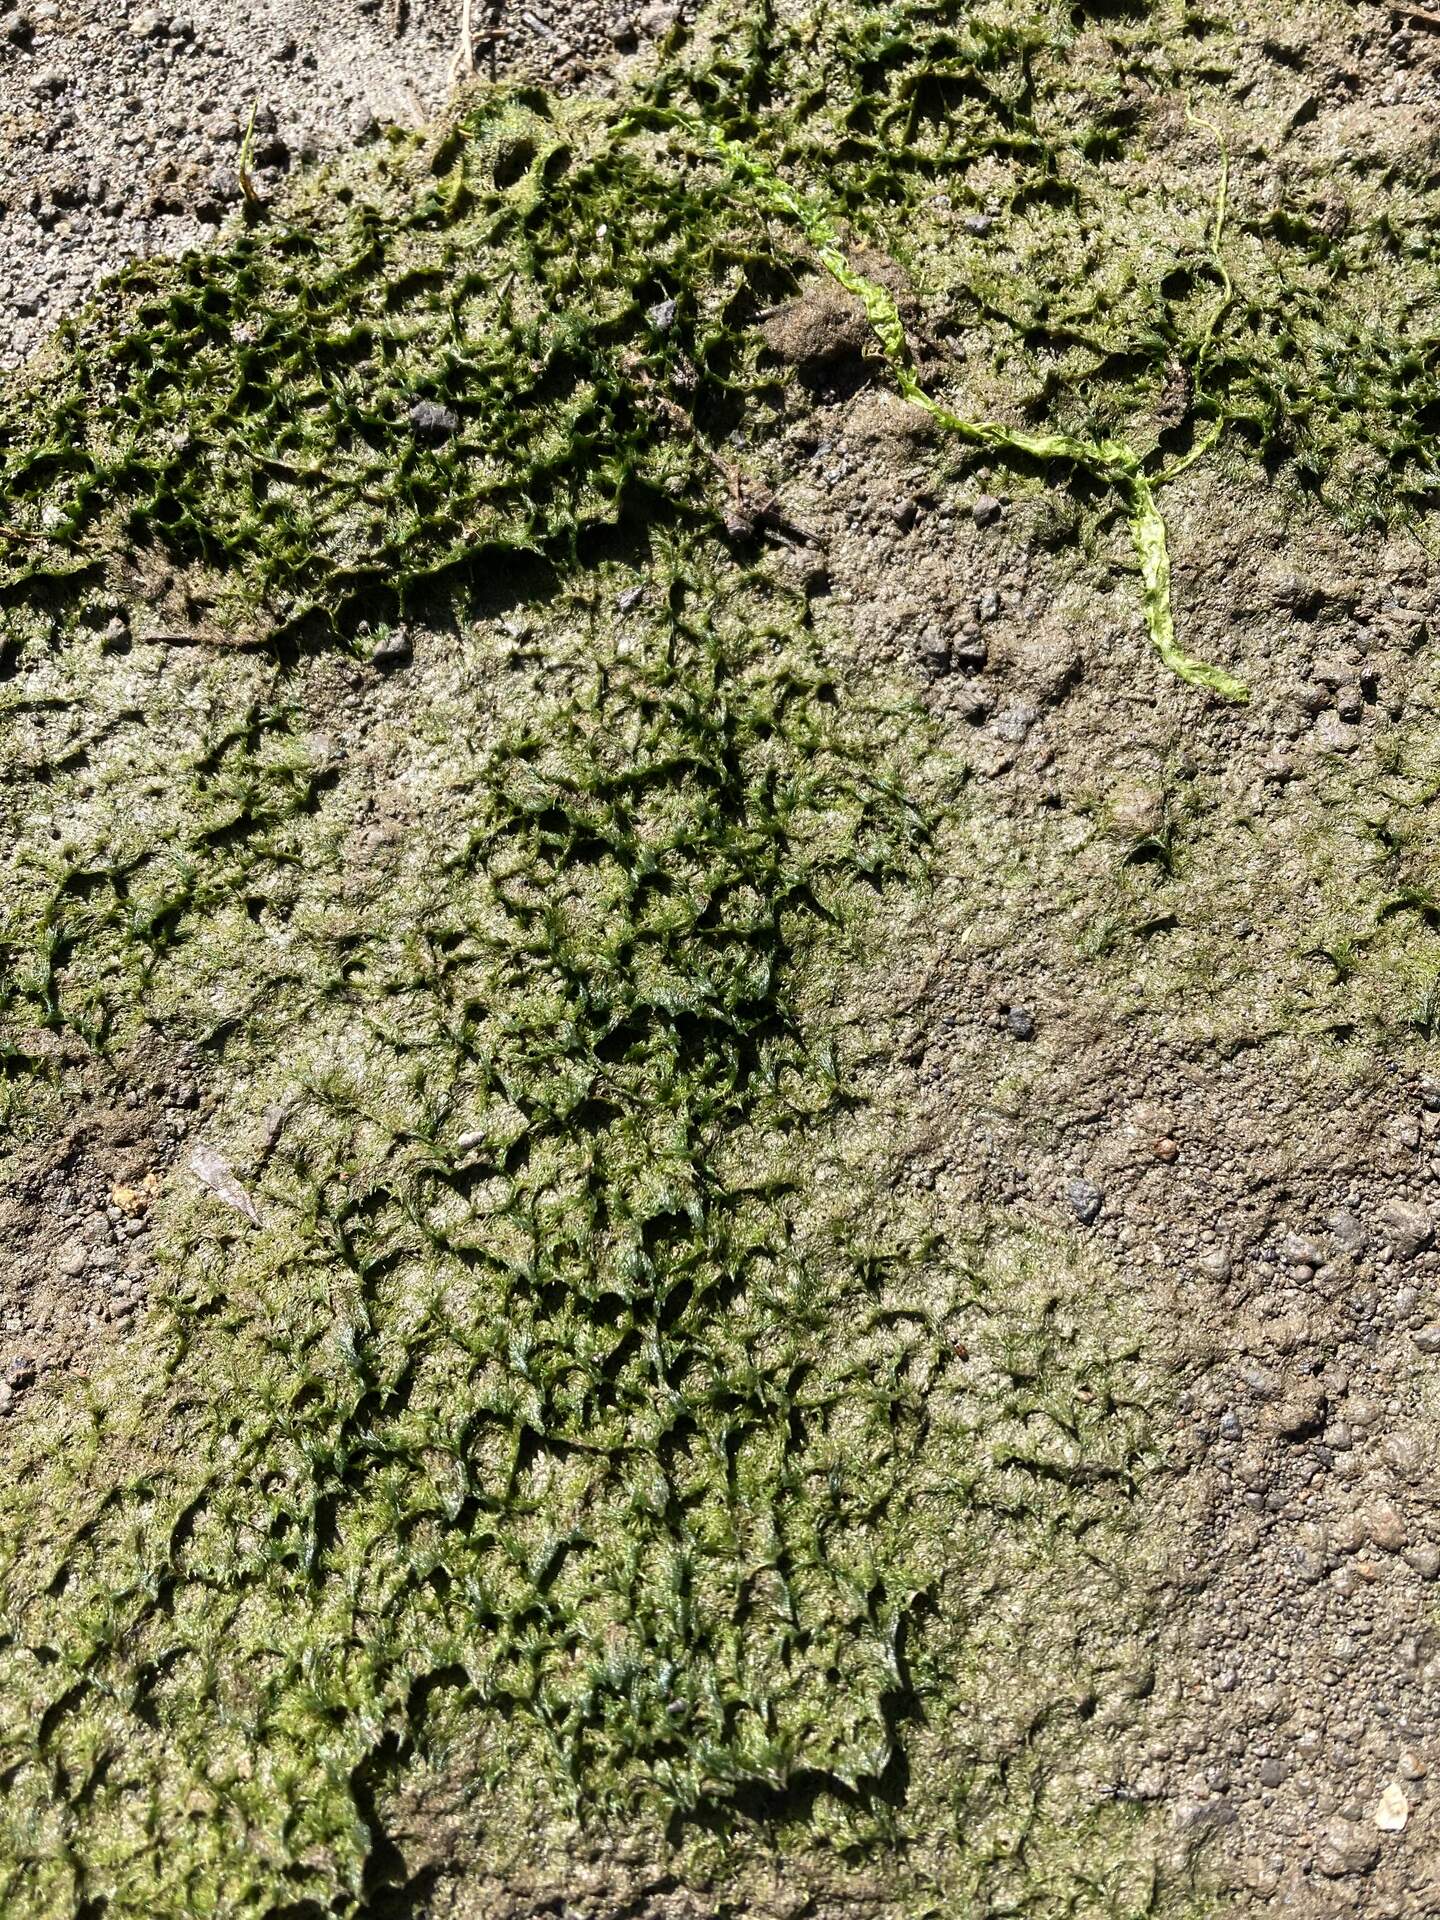
20240501HS_Algae.jpg ( 2024-05-01 16:13:26 ) Full size: 1440x1920
Close up of the algae on the mud
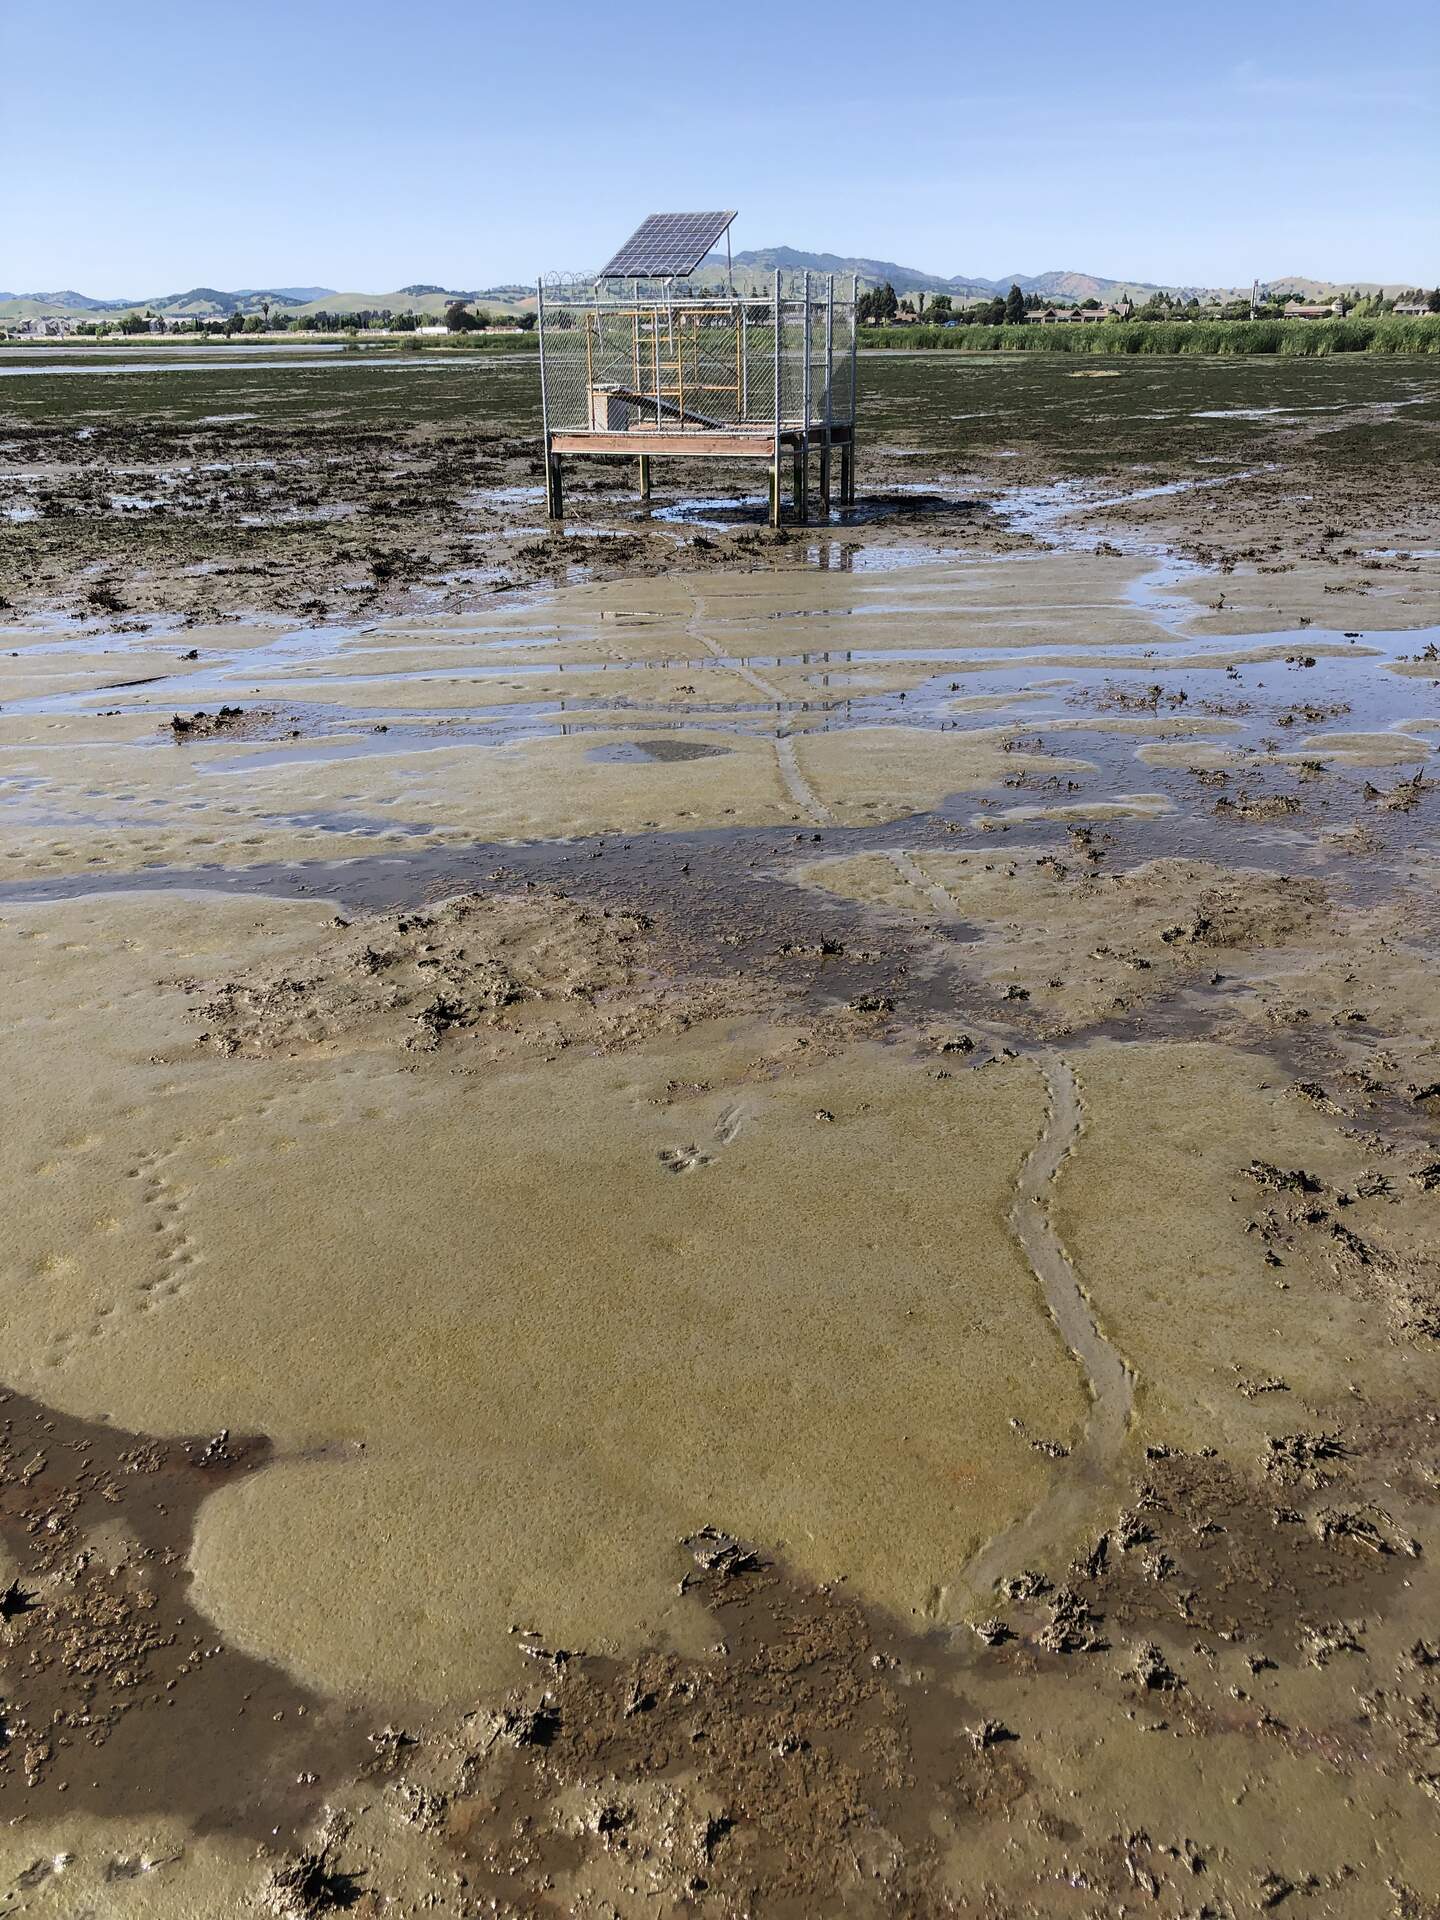
20240501HS_MudPrints.jpg ( 2024-05-01 16:08:49 ) Full size: 1440x1920
Interesting tracks in the mud
4 sets found
21 HS_met graphs found
4 HS_flux graphs found
1 HS_cam graphs found
Can't check HS_Processed
2 HS_Processed graphs found