Field Notes
<--2024-01-30 11:30:00 | 2024-02-16 10:30:00-->Other sites visited today: Gilbert Tract | East End | West Pond | Hill Slough
Phenocam link: Searching...
Mayberry: 2024-02-12 12:15:00 (DOY 43)
Author: Daphne Szutu
Others: Kyle
Summary: Kyle D. installed homemade sippers--hard to draw sample, no dfPAR data for past two weeks--fixed, lots of blowdown from recent storms
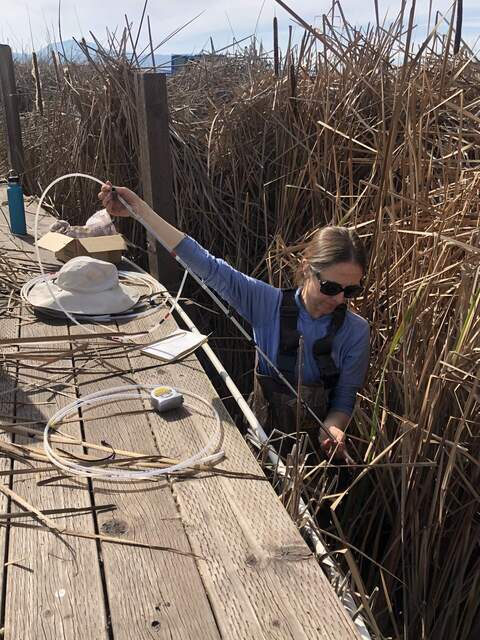
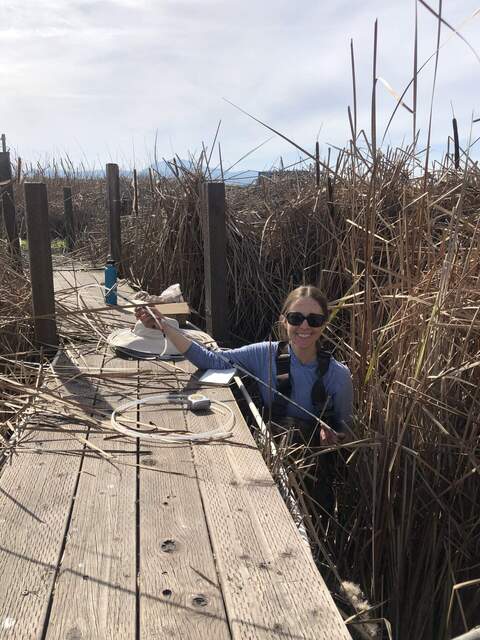
| 2024-02-12 Mayberry Kyle and I arrived around 12:15 PST. It was calm, cool, and mostly sunny with thin clouds. There have been several storms since our last visit, so last year’s litter has been blown down by at least a meter. The mallows and grass on the interior levee roads are all doing great. There’s a little more water now, and the staff gauge read 26cm. We could see a smoke plume to our west. We moved the upper boardwalk back up (it had been moved lower down for storm prep) and left it there since there don’t seem to be any crazy winds in the current forecast. Kyle got started with installing her homemade sippers. They are made out of 7’ lengths of plastic tubing (1/4” OD, 1/8” ID?). Several small holes are drilled on the bottom and covered with a mesh screen. Some sippers have all holes covered with mesh (fully screened), and some sippers have only some holes covered with mesh (half-screened). The bottom of the tubing has a stainless-steel screw and washer attached to give the tubing tip enough structural integrity to be driven into the mud. She installed three profiles today, all in close proximity to the tules. The sippers are color coded by profile and depth. Yellow = 10cm, Red = 10cm, White = 30cm, Black = 40cm, Green=50cm. Blue profile – under radiometer boom on west side of tower Black profile – about 1m south of Blue profile, on west side of boardwalk walkway Red profile – on east side of boardwalk walkway, directly across from the Black profile and about 50cm from the staff gauge After installation, we tried pulling water from 4 of the sippers, 2 fully screened and 2 half screened. We were able to get some muddy water from one of the half screened sippers after much pulling. We removed one of the fully screened sippers and installed one of the original, screened sippers in its place, but we also couldn’t pull any water from that original sipper either. We’ll keep thinking about it, and maybe Kyle will come out later this week to test them again. I cleaned flux and rad sensors and downloaded met, cam, and USB GHG data. The reservoir was almost empty; I refilled it. There was no diffuse PAR data for the past two weeks because I think there was an SDI-12 conflict with the newly installed CS655 sensors. The dfPAR CR10X and the two CS655 sensors were all installed on C5 with different SDI-12 addresses, so I’m not sure what was wrong. I moved the CS655 sensors (SDI-12 addresses 0 and 1) to C7 with the CTD sensor. I changed the CTD SDI-12 address from 0 to 3 so it wouldn’t conflict with the CS655 sensors. I chose 3 as the CTD SDI-12 address because that’s the last number of its serial number. I uploaded a new CR1000 program with the port/address changes and confirmed that the dfPAR, CS655 sensors, and CTD were all reporting reasonable number. The 7500 read: 435ppm CO2, 396mmol/m3 H2O, 14.7C, 101.4kPa, 102SS—102 after cleaning The 7700 read: 2.22ppm CH4, 36RSSI – 72 after cleaning We left at 14:00 PST. |
2 photos found

20240212MB_KyleSippers.jpg ( 2024-02-12 12:55:09 ) Full size: 1440x1920
Kyle installing sipper profile off of the boardwalk

20240212MB_KyleSippers2.jpg ( 2024-02-12 12:55:36 ) Full size: 1440x1920
Kyle installing sipper profile off of the boardwalk
11 sets found
7 MB_flux graphs found
No data found for MB_met.
28 MB_tule graphs found
Can't check MBWPEESWGT_mixed
1 MB_cam graphs found
Can't check MBEEWPSWEPGT_cam
Can't check SIMBTWEE_met
1 MB_minidot graphs found
Can't check MBSWEEWPBCBA
1 MB_processed graphs found
Can't check MB_fd
1 MB_fd graphs found

