
Field Notes
<--2024-01-30 13:25:00 | 2024-02-28 14:00:00-->Other sites visited today: Gilbert Tract | Mayberry | West Pond | Hill Slough
Phenocam link: Searching...
East End: 2024-02-12 14:35:00 (DOY 43)
Author: Daphne Szutu
Others: Kyle
Summary: Lots of blowdown from recent storms, gas pad lake is larger, smoky air
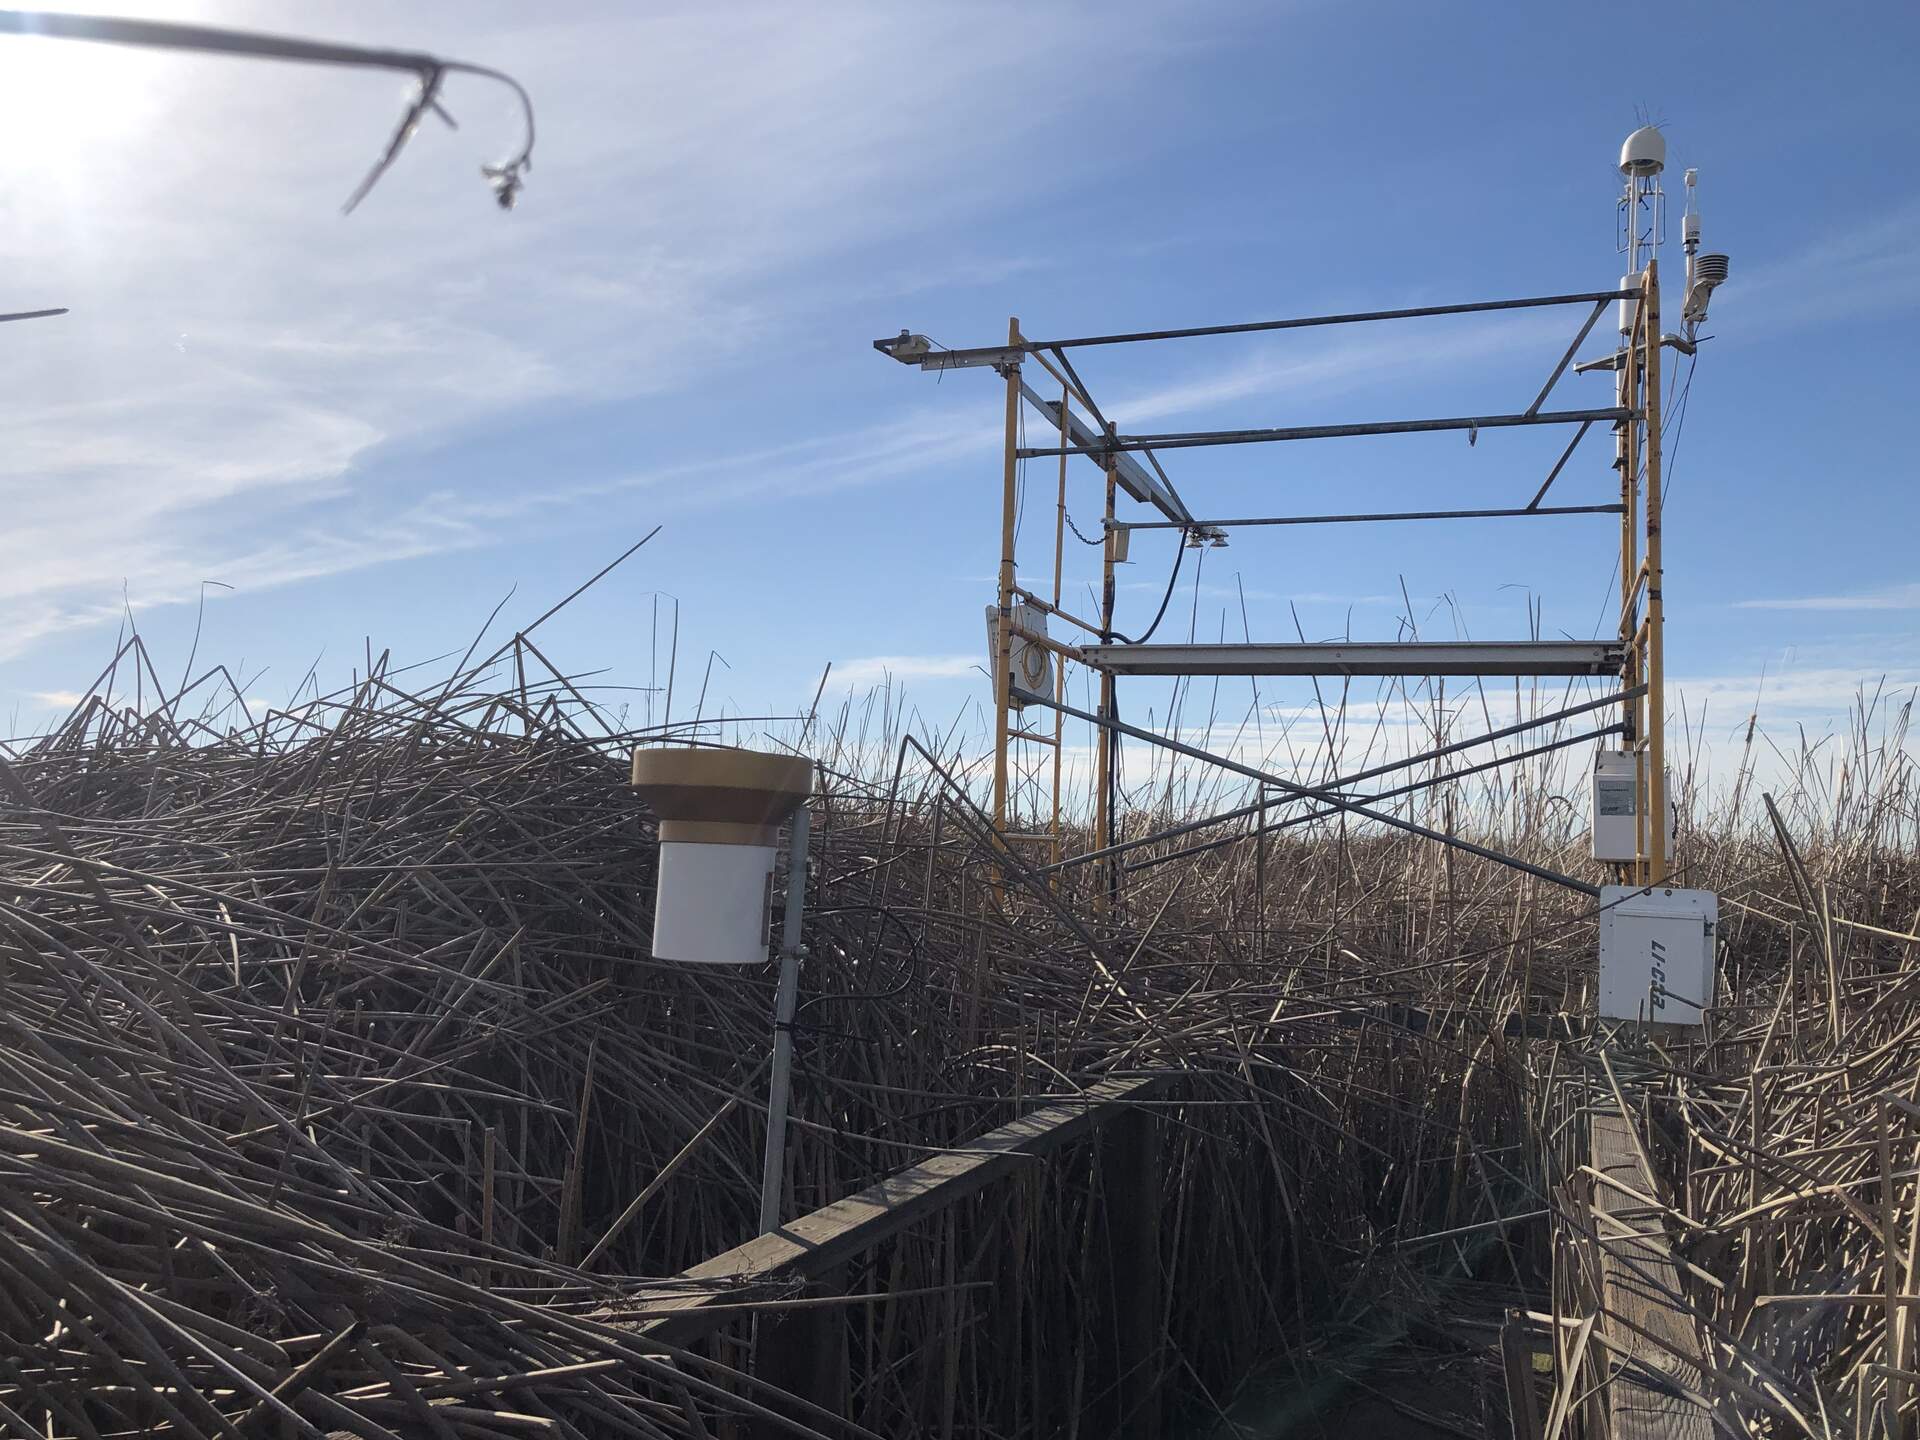
| 2024-02-12 East End Kyle and I arrived at 14:35 PST. It was calm, cool, and mostly cloudy. The air smelled smoky, although we couldn’t see a defined smoke plume from where we were. The gas pad lake is larger than before. We were driving a Jeep truck and enough water splashed up to completely obscure the front window. There have been several storms since our last visit, so last year’s litter has been blown down by 1-2 meters. We could easily see the tower from down the road. We moved the upper boardwalk back up (it had been moved lower down for storm prep) and left it there since there don’t seem to be any crazy winds in the current forecast. The staff gauge read 69cm. I downloaded met, cam, and USB GHG data. The wash reservoir was ½ full; Kyle refilled it and cleaned the flux and rad sensors. I changed the eddy clock +45sec from 14:47:30 to 14:48:15 to match the laptop time and restarted logging. The 7500 read: 439ppm CO2, 414mmol/m3 H2O, 18.6C, 101.8kPa, 95SS – 96SS after cleaning The 7700 read: 2.18ppm CH4, 41RSSI -- 77 after cleaning We measured the surface water with the handheld YSI probe. Sample, temperature-compensated conductivity, temperature Surface, 668 uS, 6.9 degC We left at 14:50 PST. |
1 photos found
20240212EE_Blowdown.jpg ( 2024-02-12 14:51:27 ) Full size: 1920x1440
A lot of blowdown from the Feburary 3-4 storm. No interference for the precip bucket now!
11 sets found
14 EE_met graphs found
Can't check EE_mixed
1 EE_mixed graphs found
8 EE_flux graphs found
Can't check MBWPEESWGT_mixed
1 EE_cam graphs found
Can't check MBEEWPSWEPGT_cam
Can't check SIMBTWEE_met
Can't check EE_Temp
5 EE_Temp graphs found
Can't check EE_minidot
1 EE_minidot graphs found
Can't check MBSWEEWPBCBA
1 EE_processed graphs found