Field Notes

<--2023-11-20 12:45:00 | 2023-12-22 15:30:00-->
Other sites visited today: Hill Slough | Gilbert Tract | Bouldin Corn | West Pond | East End

Bouldin Alfalfa: 2023-12-07 15:10:00 (DOY 341)
Author: Daphne Szutu
Others: Robert

Summary: Regular data collection/cleaning, cold and rainy day after chamber/soil sampling at Gilbert Tract in the morning

2023-12-07
Bouldin Alfalfa

Robert and I arrived at 15:10 PST. It was cold and breezy. There was a rain shower for the first 10 minutes we were there, but then we saw multiple rainbows and a nice view of sunbeams filtering down in front of Mt. Diablo. We are servicing Twitchell/Bouldin Islands after helping with Kuno’s chamber/soil sampling campaign in the first part of the day.

I downloaded met, cam, USB GHG, FD, and IRT data. Robert cleaned flux and rad sensors. I changed the eddy clock +2min to match the laptop time and restarted logging.

The 7500 read: 419ppm CO2, 511mmol/m3 H2O, 13.0C, 102.1kPa, 98SS—forgot to write after cleaning

We left at 15:25 PST.

Next Mowing: 2024-01-05

1 photos found

Sunbeams in front of Mount Diablo. This was shortly after a brief rain shower.
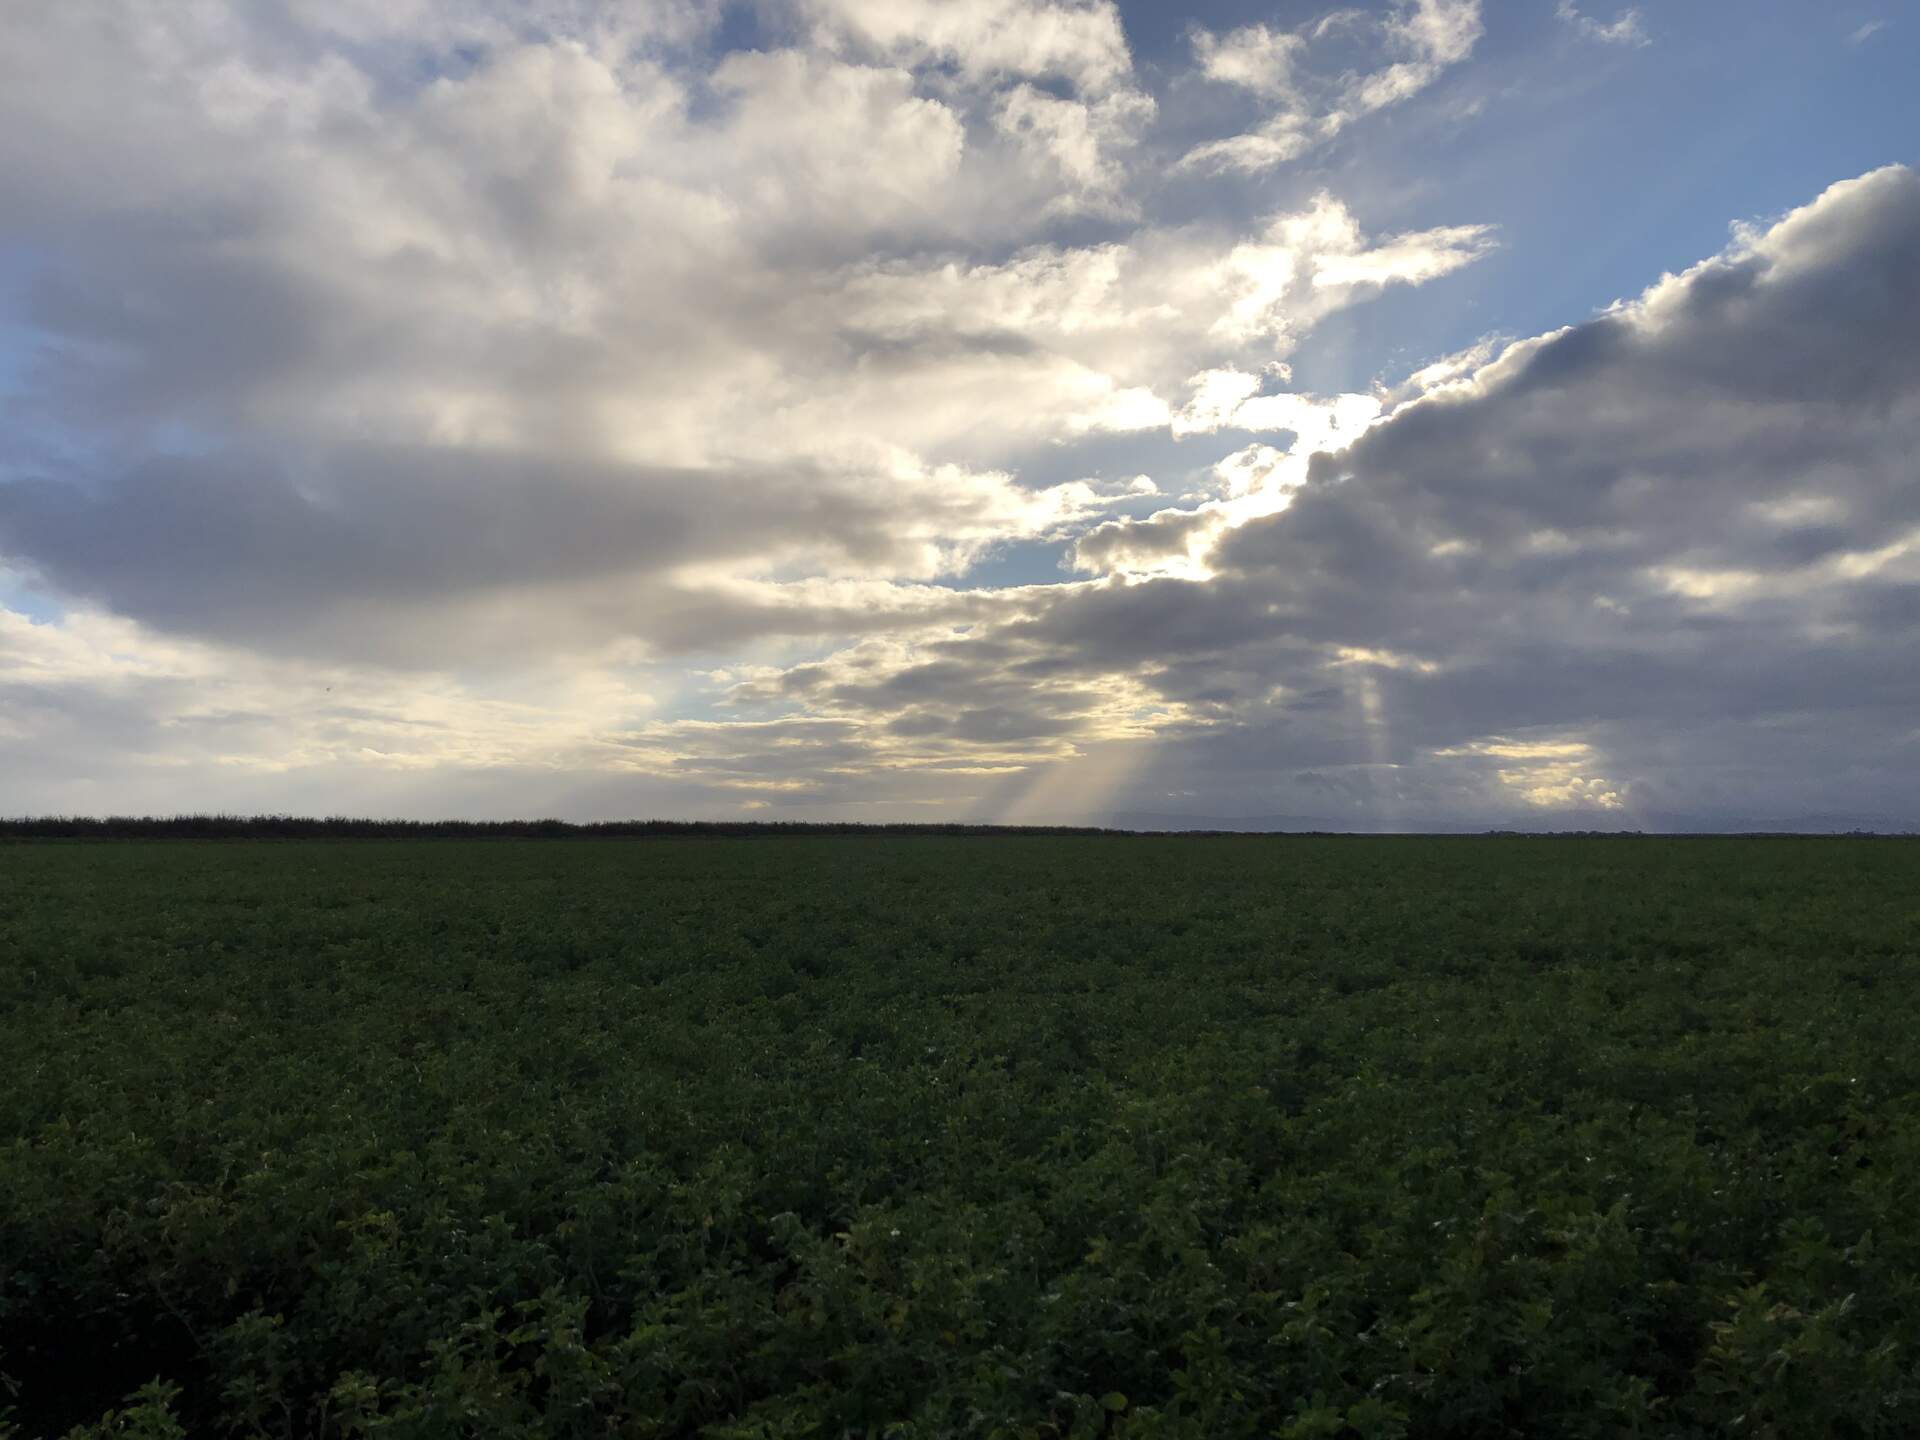
20231207BA_Sunbeams.jpg ( 2023-12-07 15:28:12 ) Full size: 1920x1440
Sunbeams in front of Mount Diablo. This was shortly after a brief rain shower.

Graphs display:
7 sets found

4 BA_flux graphs found

Explore the graph:Wind in a new window

Explore the graph:LI-7500 CO2 and H2O in a new window

Explore the graph:Counts in a new window

Explore the graph:CO2 in ppm in a new window

21 BA_met graphs found

Explore the graph:Soil Temperatures Set A in a new window

Explore the graph:Soil Temperatures Set B in a new window

Explore the graph:Soil Temperatures Set C in a new window

Explore the graph:Soil Heat Flux in a new window

Explore the graph:Temperature in a new window

Explore the graph:Solar Radiation in a new window

Explore the graph:Air Pressure and RH in a new window

Explore the graph:Soil Moisture in a new window

Explore the graph:PAR in a new window

Explore the graph:PRI Channels in a new window

Explore the graph:NDVI channels in a new window

Explore the graph:Battery Voltage in a new window

Explore the graph:NDVI and PRI in a new window

Explore the graph:Apogee NDVI in a new window

Explore the graph:FD Chamber A CO2 and Temp in a new window

Explore the graph:FD Chamber B CO2 and Temperature in a new window

Explore the graph:Surface Temperature in a new window

Explore the graph:Sentek Soil Moisture profile in a new window

Explore the graph:Sentek Soil Temperature profile in a new window

Explore the graph:Sentek Soil Salinity profile in a new window

Explore the graph:Forced Diffusion Soil CO2 Flux in a new window

6 BA_arable graphs found

Explore the graph:Incoming Solar Bands in a new window

Explore the graph:Reflected Solar Bands in a new window

Explore the graph:Solar Radiation in a new window

Explore the graph:Temperatures, PPT in a new window

Explore the graph:Sentek Deep Soil Moisture in a new window

Explore the graph:Pressure, RH in a new window

Can't check TATWBABCSB_cam
Can't check MBSWEEWPBCBA
2 BA_processed graphs found

Explore the graph:Energy in a new window

Explore the graph:Evapotranspiration in a new window

No data found for BA_adex.