
Field Notes
<--2023-11-28 10:00:00 | 2023-12-22 10:05:00-->Other sites visited today: Hill Slough | Bouldin Corn | Bouldin Alfalfa | West Pond | East End
Phenocam link: Searching...
Gilbert Tract: 2023-12-07 08:30:00 (DOY 341)
Author: Daphne Szutu
Others: Kuno, Ari, Arman, Kyle, Carlos, Robert
Summary: Kuno's chamber/soil sampling campaign, cold and wet, cattails on edge of wetland have been trimmed, regular data collection/cleaning
| 2023-12-07 Gilbert Tract Kuno, Ari, Arman, Kyle, and I arrived around 8:30 PST for Kuno’s chamber/soil sampling campaign. We are taking CH4, CO2, and N2O measurements with homemade dark and clear chambers. We are also measuring water quality parameters (temperature, pH, DO, conductivity, turbidity, ORP, WTD), taking 10cm deep soil samples, taking dissolved gas samples from the water, and recording each point with GPS. Kuno is planning to come back in June/July to sample the same points so we can compare senescent and growing season data. It was cold and breezy, starting with scattered clouds in the morning and becoming completely overcast by the afternoon. Kuno and Ari were team A, and Arman and I were team B. Kyle went back and forth between the two teams with our one syringe to take soil gas measurements. Robert and Carlos joined around 12:30pm and brought a second syringe. Carlos joined team B and Robert and I started with regular tower servicing. We took at least 20 chamber measurements using the CH4 analyzers LI-7810, one carried in the Licor backpack and one carried in my regular backpack that was secured with a bungee cord. Kuno and Ariane also took some N2O measurements afterwards with the LI-7820. High tide was around 13:00 so the water level was increasing the whole morning. The azolla "high water line" on the tules was still a good 30+cm above the water during high tide though, so it was convenient we were not sampling at max high tide. At the tower, I downloaded met, cam, and USB GHG data. Robert cleaned flux and rad sensors. I downloaded the miniDOT data but didn’t change the desiccant—next time. The reservoir was ½ full; we refilled it. There are still some drops in the Campbell conductivity sensor. We need to lower the water sensors next time. Two people from River Partners were cutting back the reeds from the wetland edge, both the east side of the parcel where our tower is and the north side where our ADCP box is. Robert chatted them up while we were waiting for the ADCP to download and it sounds like it will be a regular maintenance task to keep the wetland from taking over the “upland marsh” plants on the levee slope. It’s a little easier to access our tower now! The staff gauge read 96cm near the end of the tower visit, but I didn’t write down the exact time. Probably around 13:30 PST. The 7500 read: 421ppm CO2, 420mmol/m3 H2O, 15.6C, 102.0kPa, 100SS--101 after cleaning The 7700 read: 1.98ppm CO2, 51RSSI--80 after cleaning We went to the channel to download Flo’s data around 13:40 PST. I was not auto-prompted to reset the system clock, so I set it manually after downloading data. I restarted data collection before we left around 13:45 PST to service Bouldin and Twitchell Islands. Carlos and Ari will service Hill Slough after flux/soil sampling wraps up. |
9 photos found
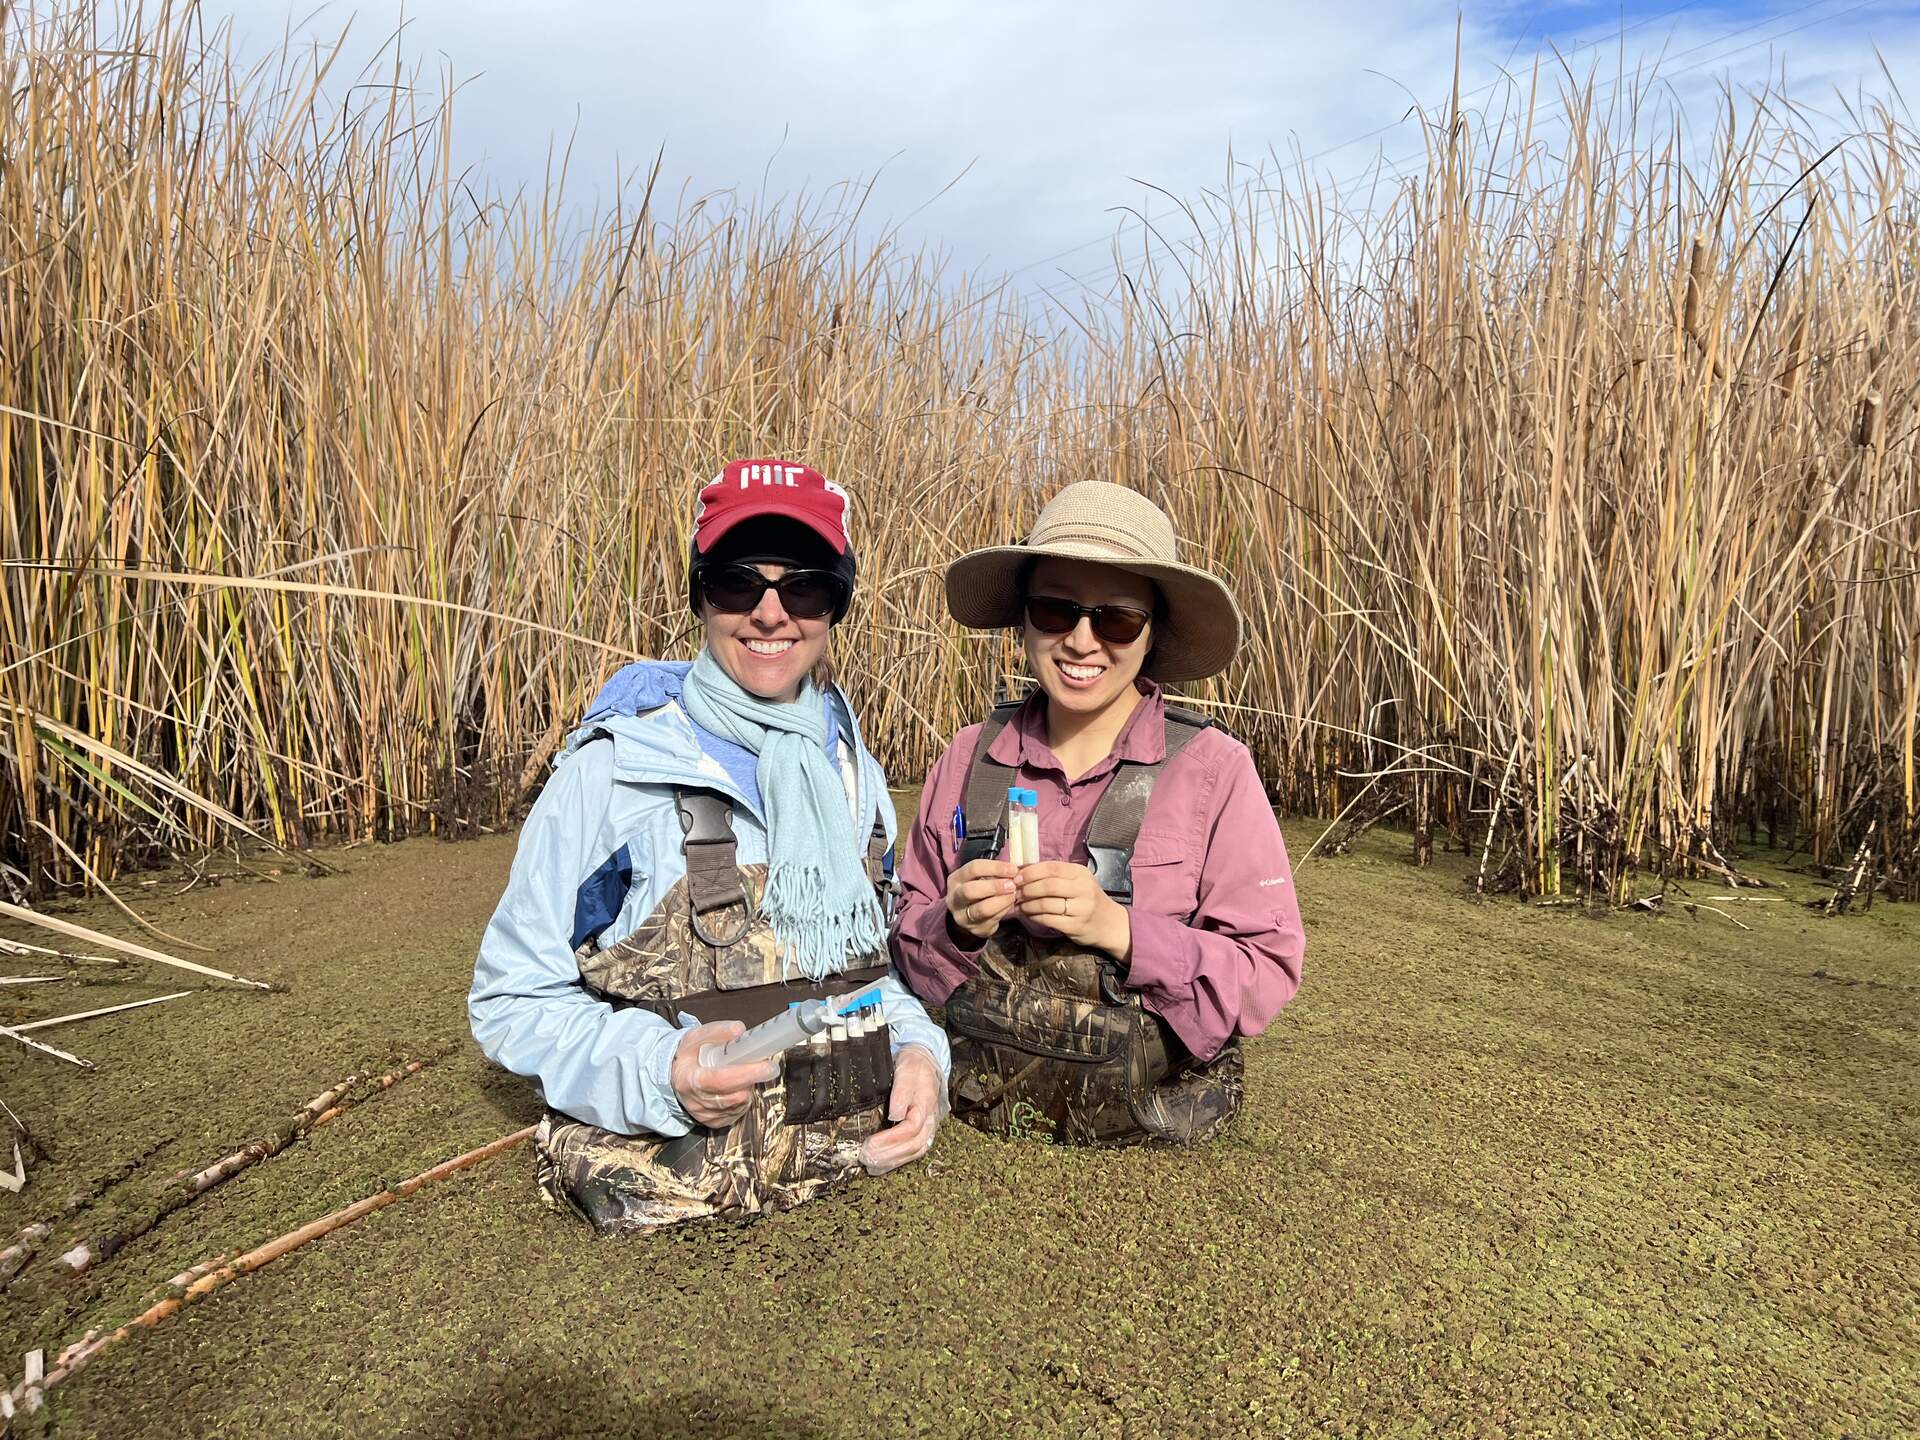
20231207GT_KyleDaphne.jpg ( 2023-12-07 12:37:34 ) Full size: 1920x1440
Kyle and Daphne sampling dissolved gas during Kuno's chamber/soil sampling campaign

20231207GT_ArmanChamber.jpg ( 2023-12-07 09:53:48 ) Full size: 1440x1920
Arman carrying a Licor analyzer in my backpack and carrying a homemade dark chamber during Kuno's chamber/soil sampling campaign
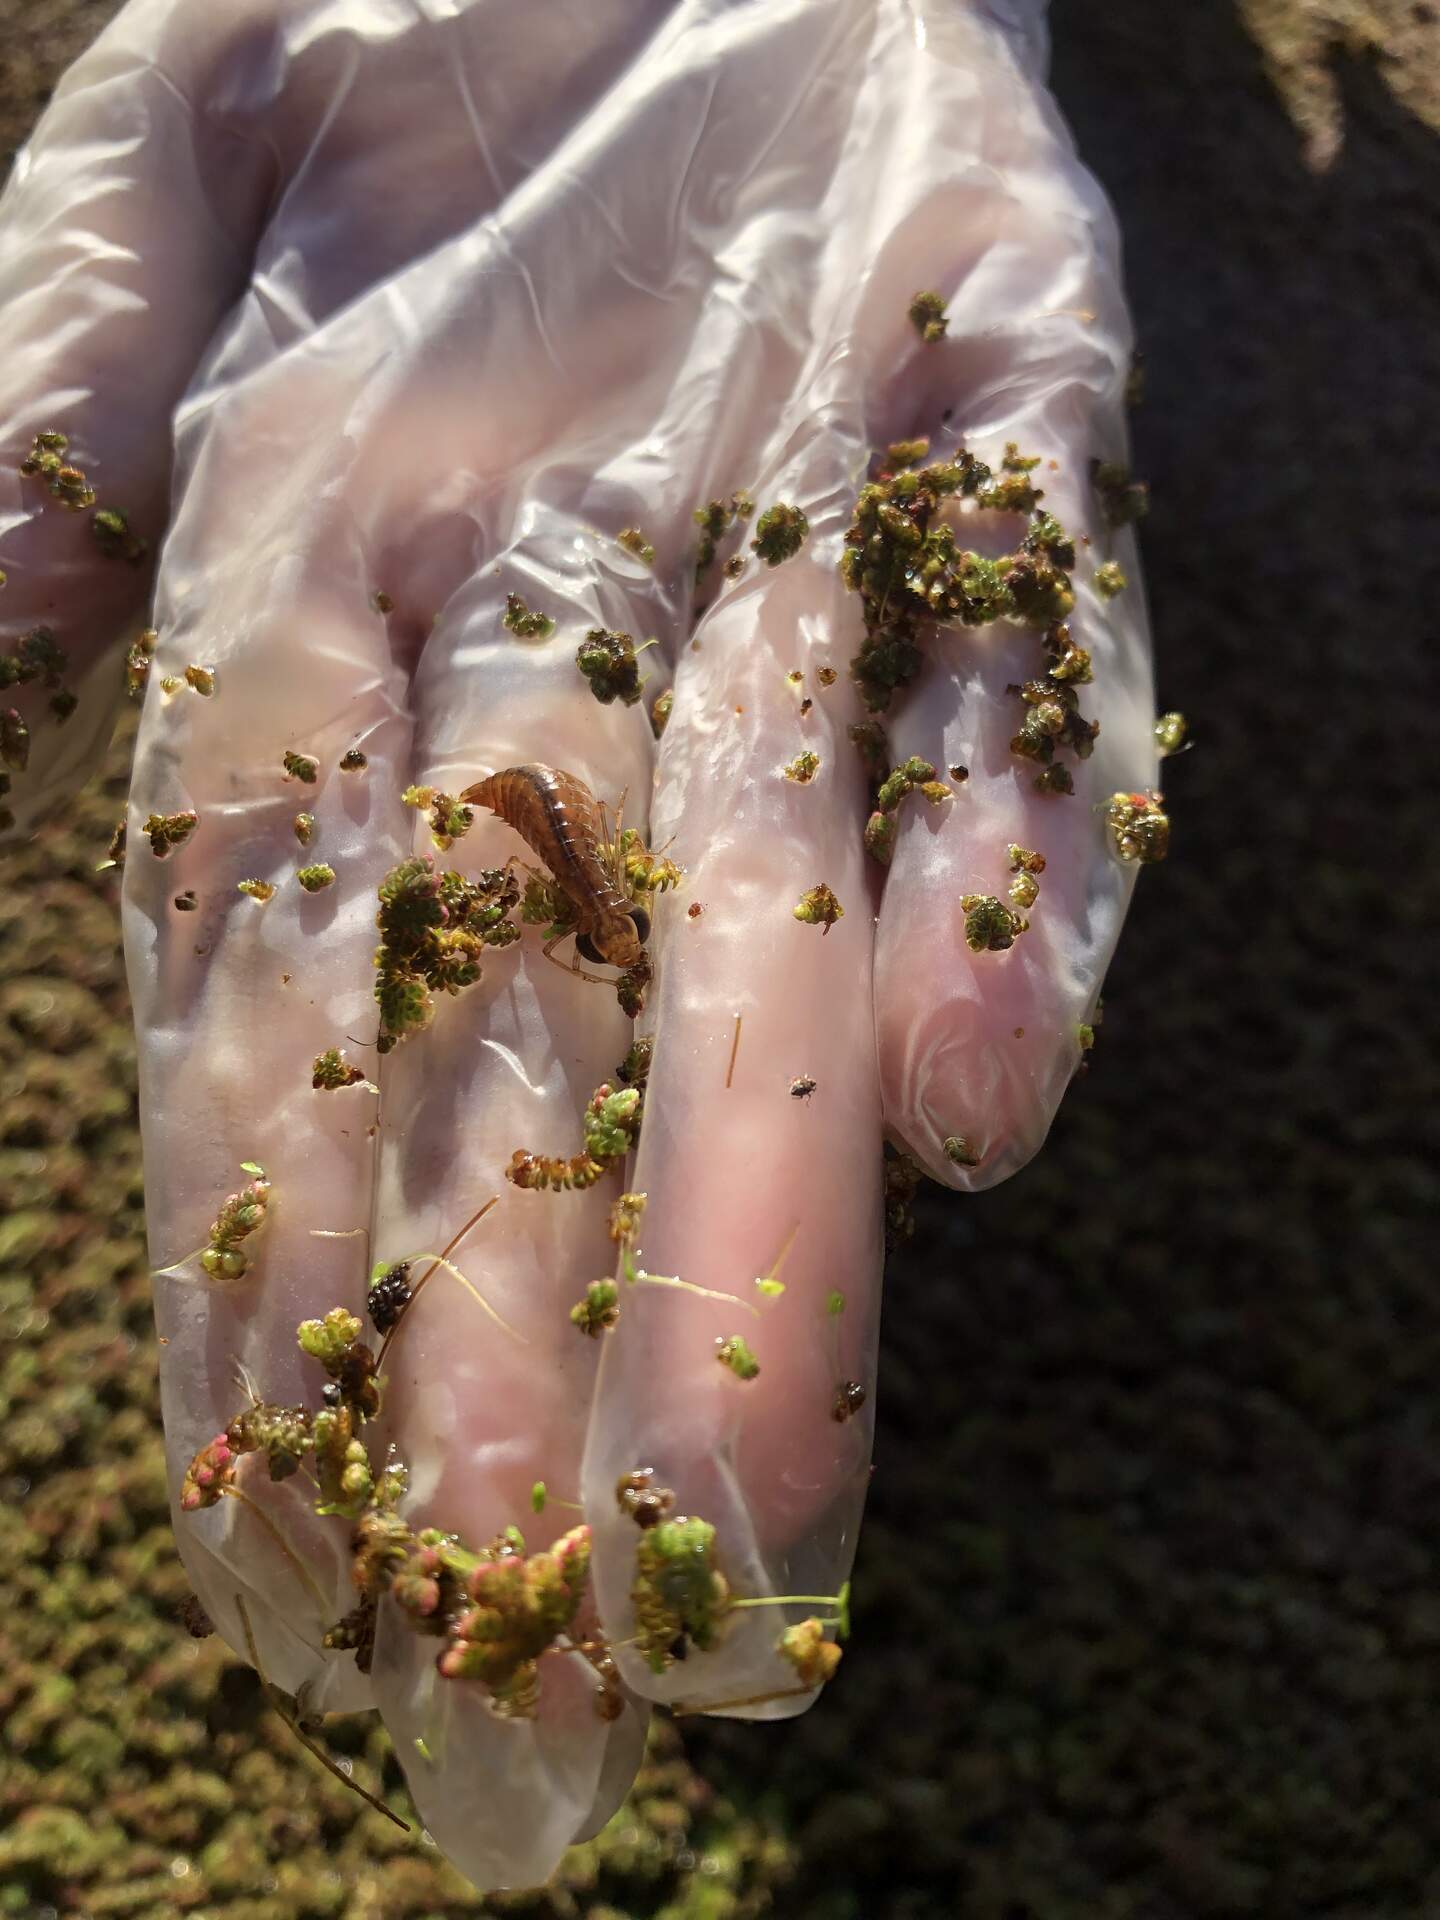
20231207GT_DragonflyNymph.jpg ( 2023-12-07 09:48:35 ) Full size: 1440x1920
Dragonfly nymph (maybe) in the azolla at Gilbert Tract
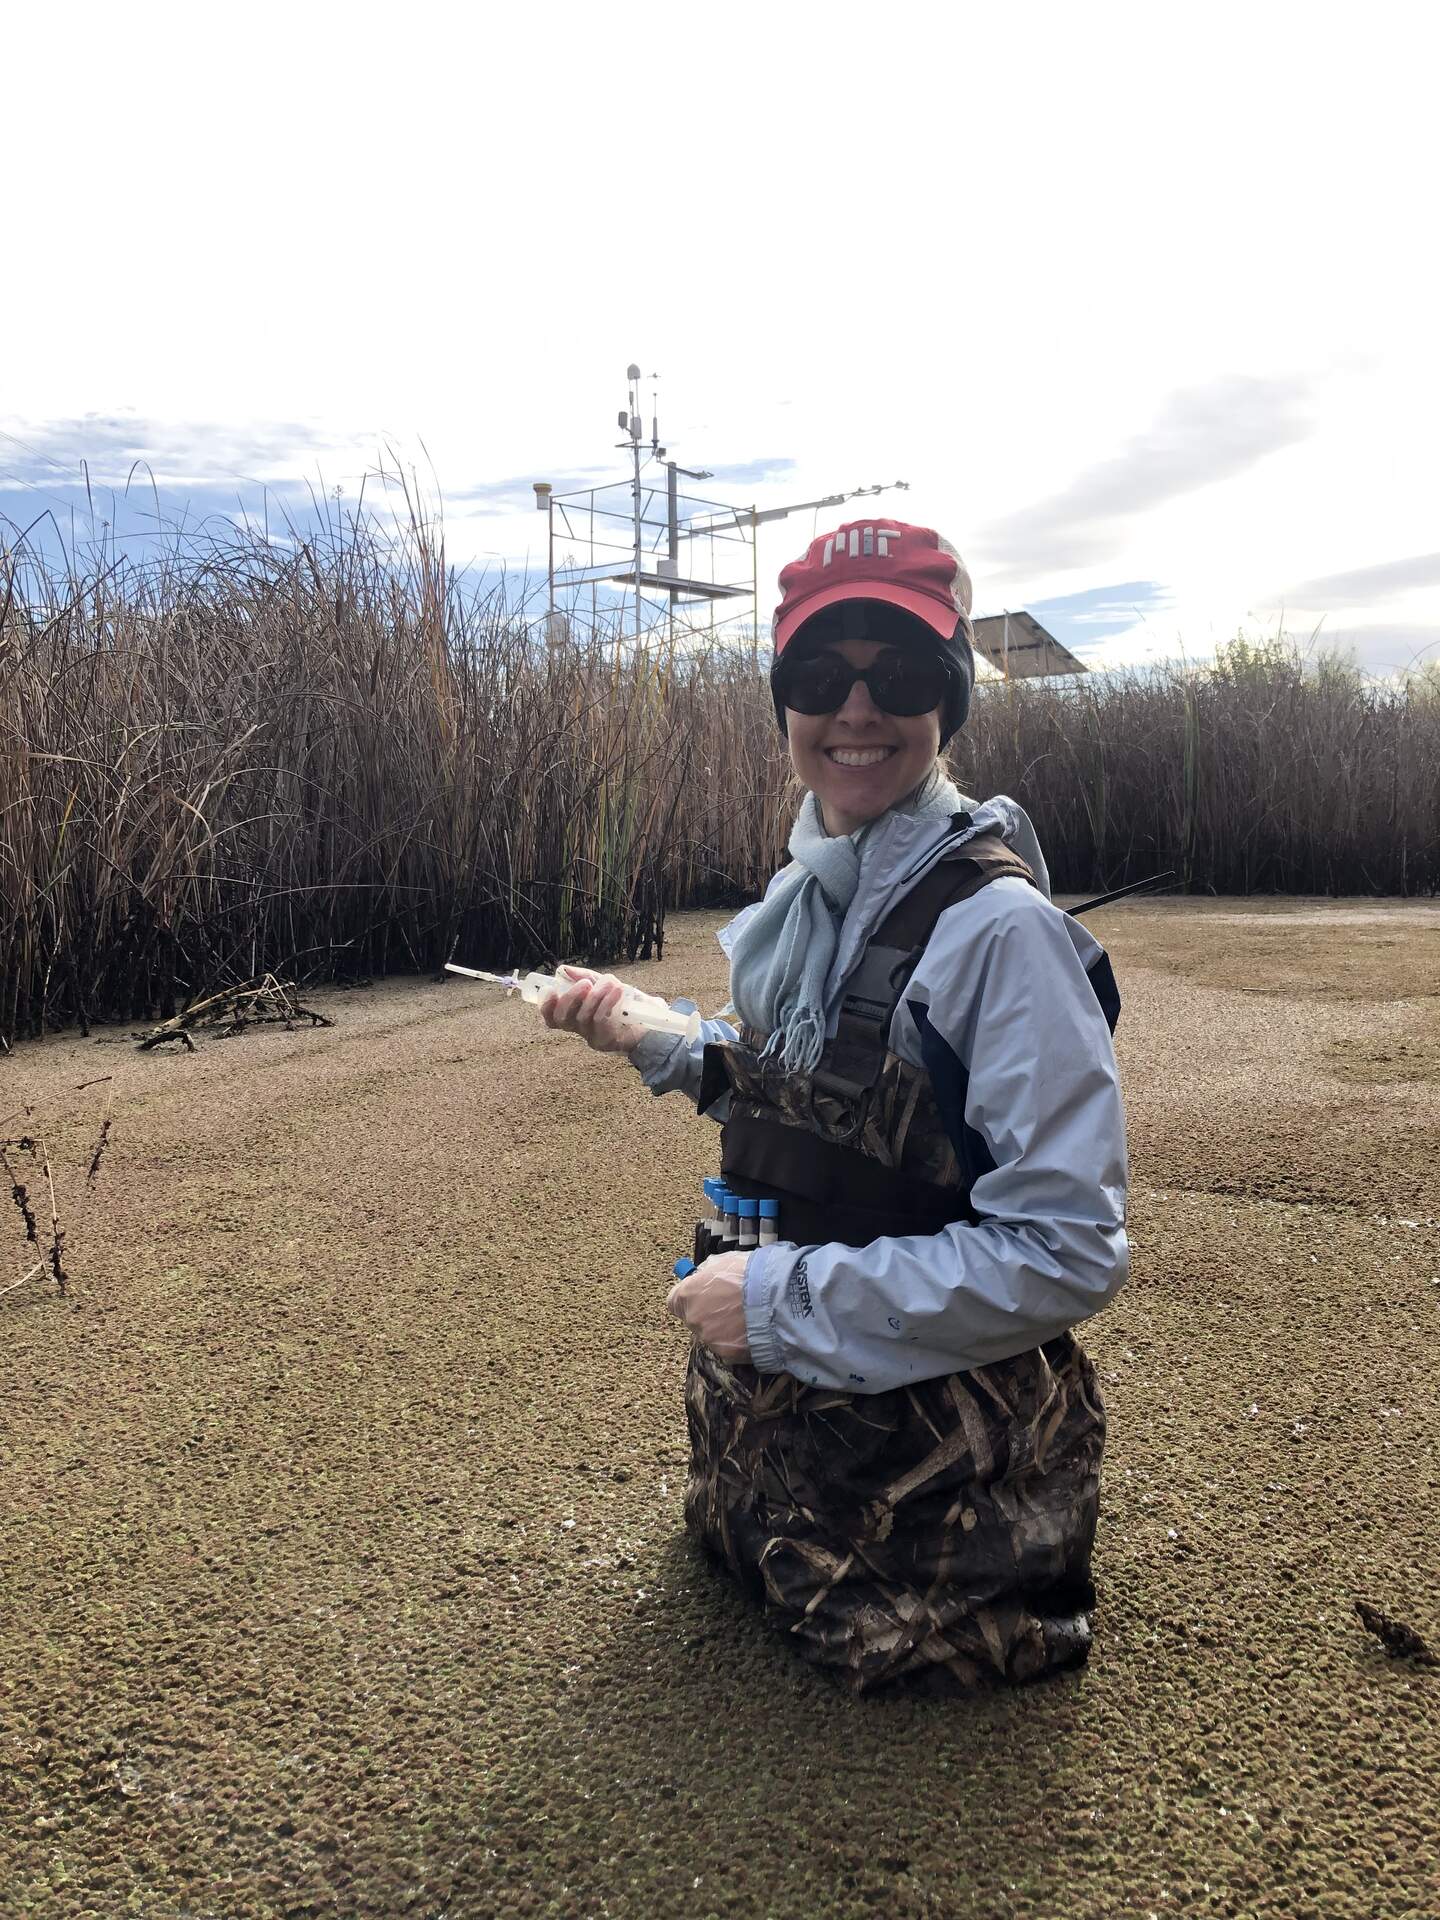
20231207GT_Kyle.jpg ( 2023-12-07 10:50:58 ) Full size: 1440x1920
Kyle sampling dissolved gas in front of the GT channel during Kuno's chamber/soil sampling campaign
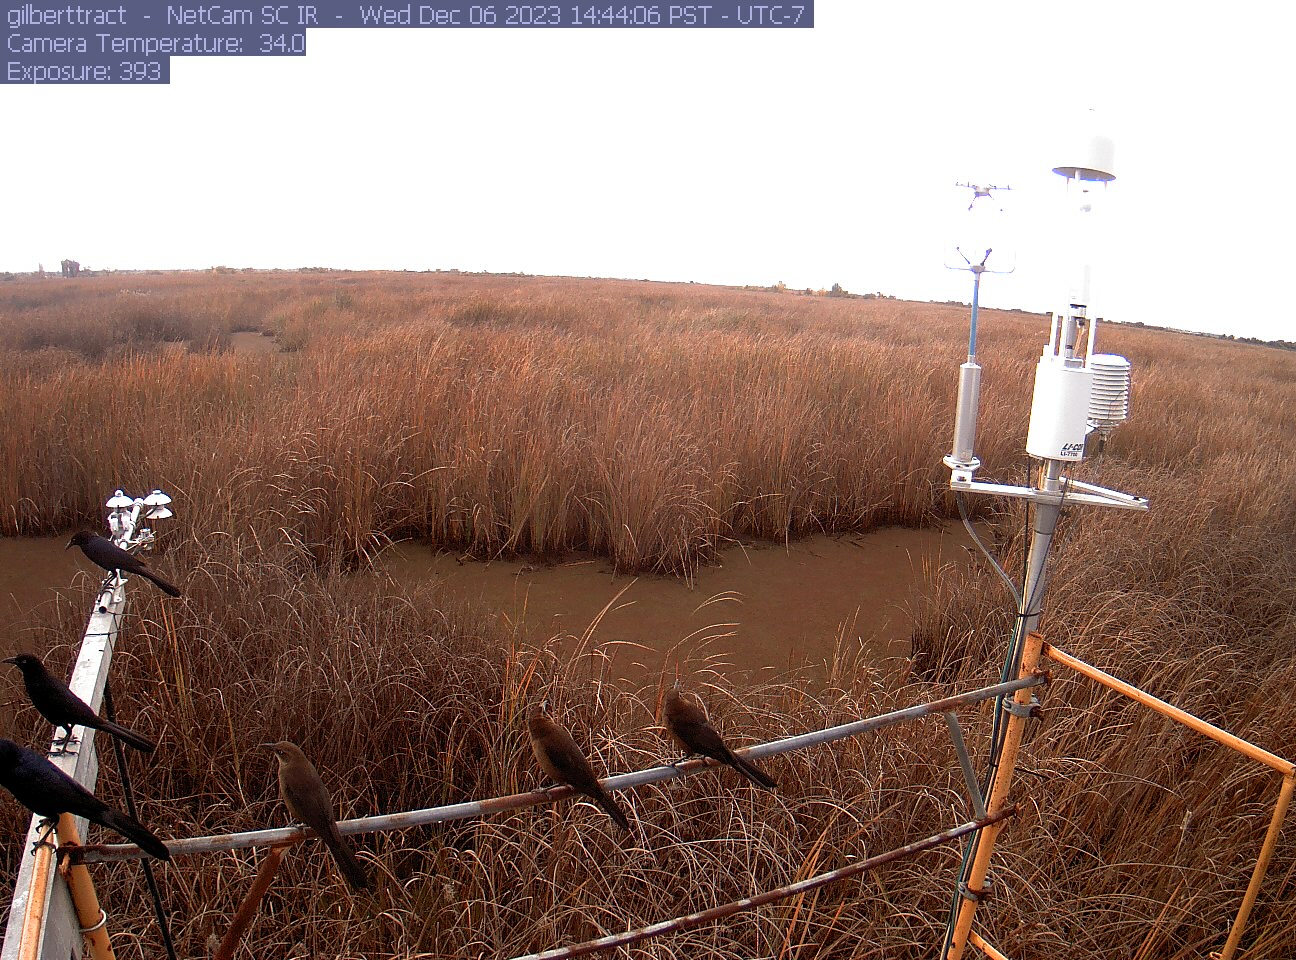
gilberttract_2023_12_06_144406.jpg ( 2023-12-06 22:49:26 ) Full size: 1296x960
Grackles on the railings
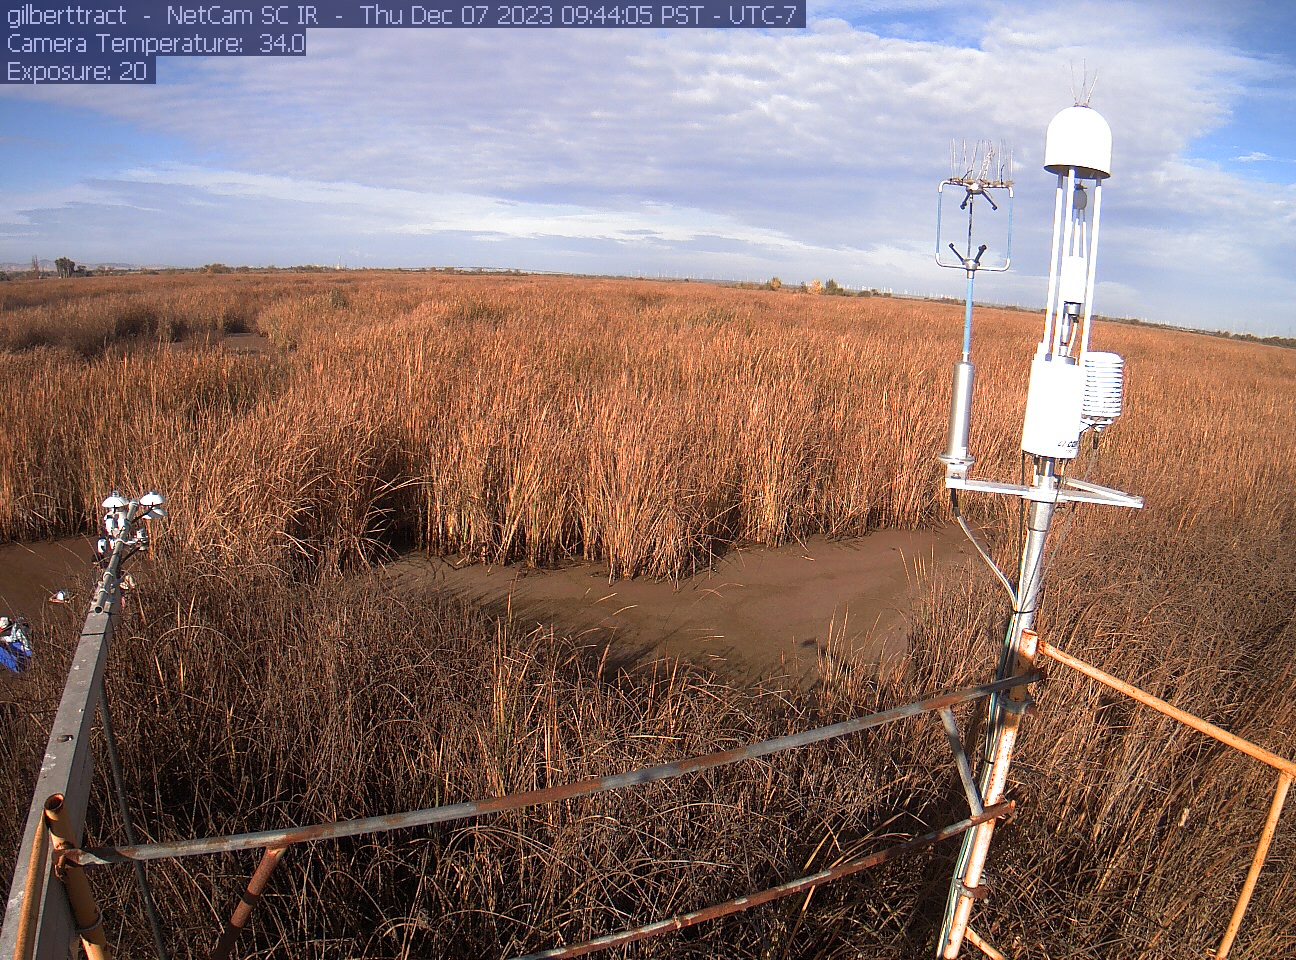
gilberttract_2023_12_07_094405.jpg ( 2023-12-07 17:49:40 ) Full size: 1296x960
Chamber soil sample field work

gilberttract_2023_12_07_101405.jpg ( 2023-12-07 18:19:32 ) Full size: 1296x960
Daphne and Arman taking chamber and soil samples
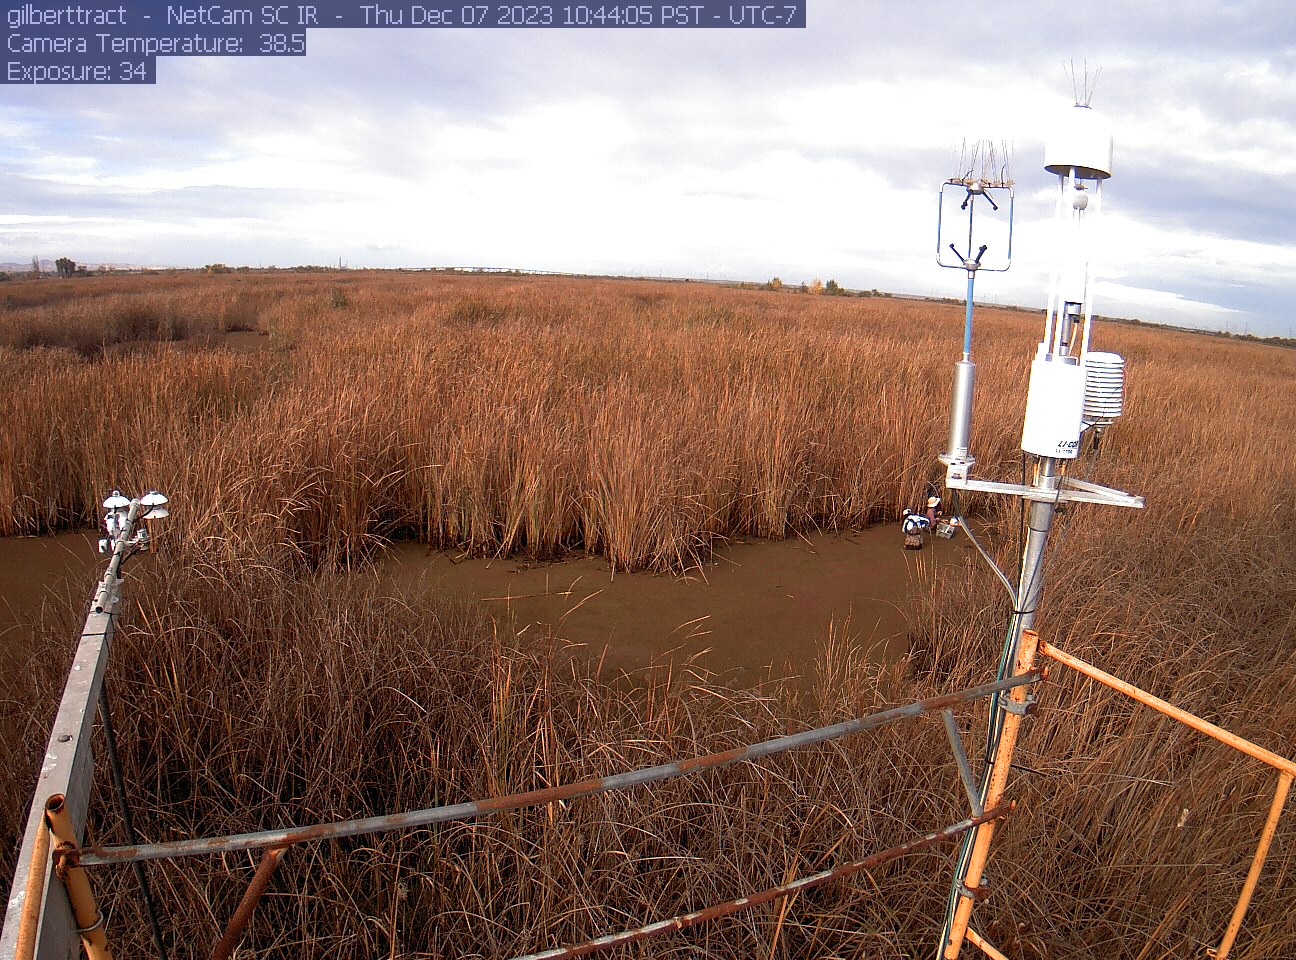
gilberttract_2023_12_07_104406.jpg ( 2023-12-07 18:49:30 ) Full size: 1296x960
Kyle and Daphne, Chamber soil sample field work
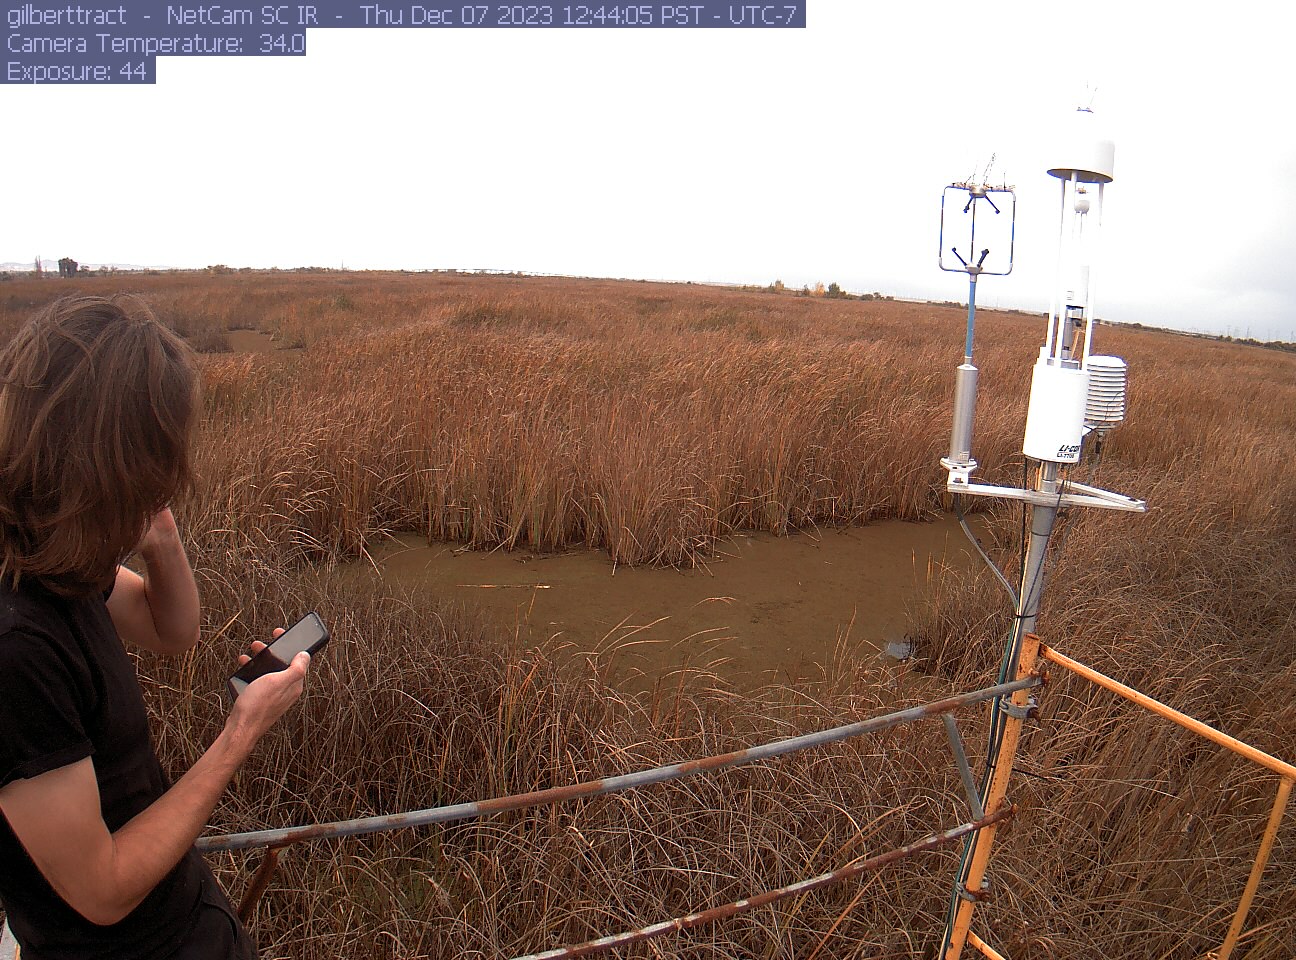
gilberttract_2023_12_07_124405.jpg ( 2023-12-07 20:49:38 ) Full size: 1296x960
Robert on phone
8 sets found
Can't check MBWPEESWGT_mixed
Can't check MBEEWPSWEPGT_cam
16 GT_met graphs found
4 GT_flux graphs found
3 GT_adcp graphs found
1 GT_cam graphs found
2 GT_usgs graphs found
No data found for GT_chanexo.