Field Notes
<--2023-09-19 13:10:00 | 2023-10-18 12:30:00-->Other sites visited today: West Pond | Vaira
Phenocam link: Searching...
Tonzi: 2023-10-04 12:10:00 (DOY 277)
Author: Joe Verfaillie
Others: Daphne
Summary: Swapped mux on Tower top met, updated program, swapped Pt Den batteries - Tree 3 seems to be dying, reset dendrometers on Trees 72 and 79, Zcam 3 needs checking
| Tonzi 2023-10-04 Daphne and I arrived at about 12:10 PDT. It was clear hot and sunny but not the oven it can be at this time of year. The ground is very dry. I saw some pock marks in the dust on the road west of the tower so there’s been a little precipitation since the last time a vehicle came through. Daphne work on the Tower top removing the old AM16/32 mux sn 1237 which has had spike problems. This was one of the sap flow muxes that got worked hard I think. She wired in a new AM16/32B sn 31675. She updated the CR1000 met program to remove the skipped channels and added the reverse Bowen stats to the main table. All seemed well. She also collected the fluxes and phenocam images. The Tower read: 422.2ppm CO2, 468.3mmol/m3 H2O, 29.0C, 98.9kPa, 100.9SS The Floor read: 425.2ppm CO2, 450.9mmol/m3 H2O, 33.0C, 99.0kPa, 98.6SS We cleaned the Floor IRGA. I did the manual measurements: moisture point, DBH, and wells. I collected the FD data on the Delta laptop. I reset the dendrometers on trees 72 and 79 that were close to maxed out. I swapped the batteries on the point dendrometers – the batteries on Tree 3 were low while the others were still okay. I marked the Tree 3 set of batteries with red x’s to watch them. I also took photos of each of the trees. Mukund pointed out that Tree 3 DBH was behaving differently than all the rest – that tree looks like it is dying. I serviced the zcams. All seemed well in the field – I manually test each of them. However back in the lab zcam 3 only had images up to 9/23. Something seems to be preventing that camera from taking photos – broken wire? I had some problems with the well sensor at the Tower well. There is a break in the insulation just above the heat shrink that connects it to the weight. If that part gets wet it will make a connection. I need to seal up that break. Today’s readings seem quite different than last time – need to double check. We left at about 14:30 PDT |
Field Data
No tank data
Well Depth
| Date | Location | Depth (feet) |
|---|---|---|
| 2023-10-04 | WP | 2.17 |
| 2023-10-04 | VR_well | 59.25 |
| 2023-10-04 | VR_pond | 13.8 |
| 2023-10-04 | TZ_road | 36 |
| 2023-10-04 | TZ_tower | 31.4 |
| 2023-10-04 | TZ_floor | 36.75 |
No TZ Moisture Point data found
No VR Moisture Point data found
No TZ grass heigth found
No VR grass heigth found
Tree DBH
| Date | Tag# | Reading (mm) |
|---|---|---|
| 2023-10-04 | 1 | 16.6 |
| 2023-10-04 | 102 | 3.7 |
| 2023-10-04 | 2 | 15.8 |
| 2023-10-04 | 245 | 7.6 |
| 2023-10-04 | 3 | 4.3 |
| 2023-10-04 | 4 | 6.8 |
| 2023-10-04 | 5 | 17.7 |
| 2023-10-04 | 6 | 6.4 |
| 2023-10-04 | 7 | 13.7 |
| 2023-10-04 | 72 | 20.8 |
| 2023-10-04 | 72 | 4.2 |
| 2023-10-04 | 79 | 20.6 |
| 2023-10-04 | 79 | 3.7 |
Water Potential - mode: raw
| Time | Species | Tree | readings (bar) | ||
|---|---|---|---|---|---|
| 2023-10-04 13:09:00 | OAK | 102 | -28 | -32 | -35 |
| 2023-10-04 13:09:00 | OAK | 92 | -27 | -23 | -31 |
No TZ Grass Biomass data found
No TZ OakLeaves Biomass data found
No TZ PineNeedles Biomass data found
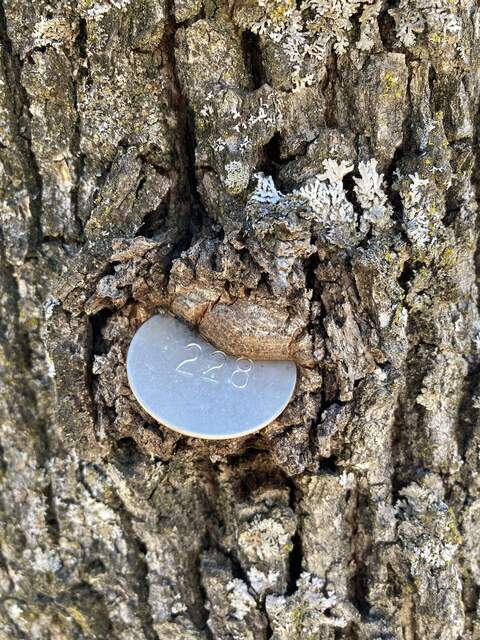
1 photos found

20231004TZ_TreeEatingATag.jpg ( 2023-10-04 14:26:23 ) Full size: 1440x1920
A tree is eating its tag
16 sets found
No data found for TZ_Fenergy.
11 TZ_tmet graphs found
No data found for TZ_soilco2.
Can't check TZ_mixed
3 TZ_mixed graphs found
1 TZ_fflux graphs found
8 TZ_fmet graphs found
No data found for TZ_tram.
3 TZ_co2prof graphs found
1 TZ_irt graphs found
No data found for TZ_windprof.
1 TZ_tflux graphs found
8 TZ_sm graphs found
Can't check TZ_met
1 TZ_met graphs found
Can't check TZVR_mixed
8 TZ_osu graphs found
3 TZ_fd graphs found
Tonzi Z-cam data

