
Field Notes
<--2023-09-19 12:15:00 | 2023-10-18 11:30:00-->Other sites visited today: West Pond | Tonzi
Phenocam link: Searching...
Vaira: 2023-10-04 11:00:00 (DOY 277)
Author: Joe Verfaillie
Others: Daphne
Summary: Standard fieldwork, Arduino RSB still running on separate logger, went to the pond.
| Vaira 2023-10-04 Daphne and I arrived at about 11:00 PDT. It was clear sunny and warm but not oven hot as it can be at this time of year. The ground and the grass are very dry and the trees have just a hint of yellowing leaves. Daphne mentioned seeing some sprouting grass in the shade under the trees out by the well. There were a few grasshoppers around. The Davis crew have moved their biomass fence from the west of our usual path to the tower to the east of our path – biggest move in many years. Daphne read the well and then collected the FD chamber data on the Delta laptop. I collected the flux, met camera data and the data from the prototype Arduino RSB. I thought I had forgotten to get the phenocam images last time but found them on the laptop instead. So two batches of photos on the laptop. The 7500 read: 423.4ppm CO2, 475.3mmol/m3 H2O, 33.8C, 99.6kPa, 105.4SS The temp was high because the sun is on the sensor. I took a bunch of photos and notes on the RSB Arduino wiring some I can make more in the lab. We went to the pond – some cows on the far side. The cows have kicked the conduit around again. I fixed it, staked it down and buried it in rock again. There was mud against the staff gauge that I cleared just enough to get a reading of 13.80ft. Bring a shovel next time. We left at about 12:00 noon PDT. |
Field Data
No tank data
Well Depth
| Date | Location | Depth (feet) |
|---|---|---|
| 2023-10-04 | WP | 2.17 |
| 2023-10-04 | VR_well | 59.25 |
| 2023-10-04 | VR_pond | 13.8 |
| 2023-10-04 | TZ_road | 36 |
| 2023-10-04 | TZ_tower | 31.4 |
| 2023-10-04 | TZ_floor | 36.75 |
No TZ Moisture Point data found
No VR Moisture Point data found
No TZ grass heigth found
No VR grass heigth found
No VR Tree DBH found
No water potential data found
No VR Grass Biomass data found
No VR OakLeaves Biomass data found
No VR PineNeedles Biomass data found
1 photos found
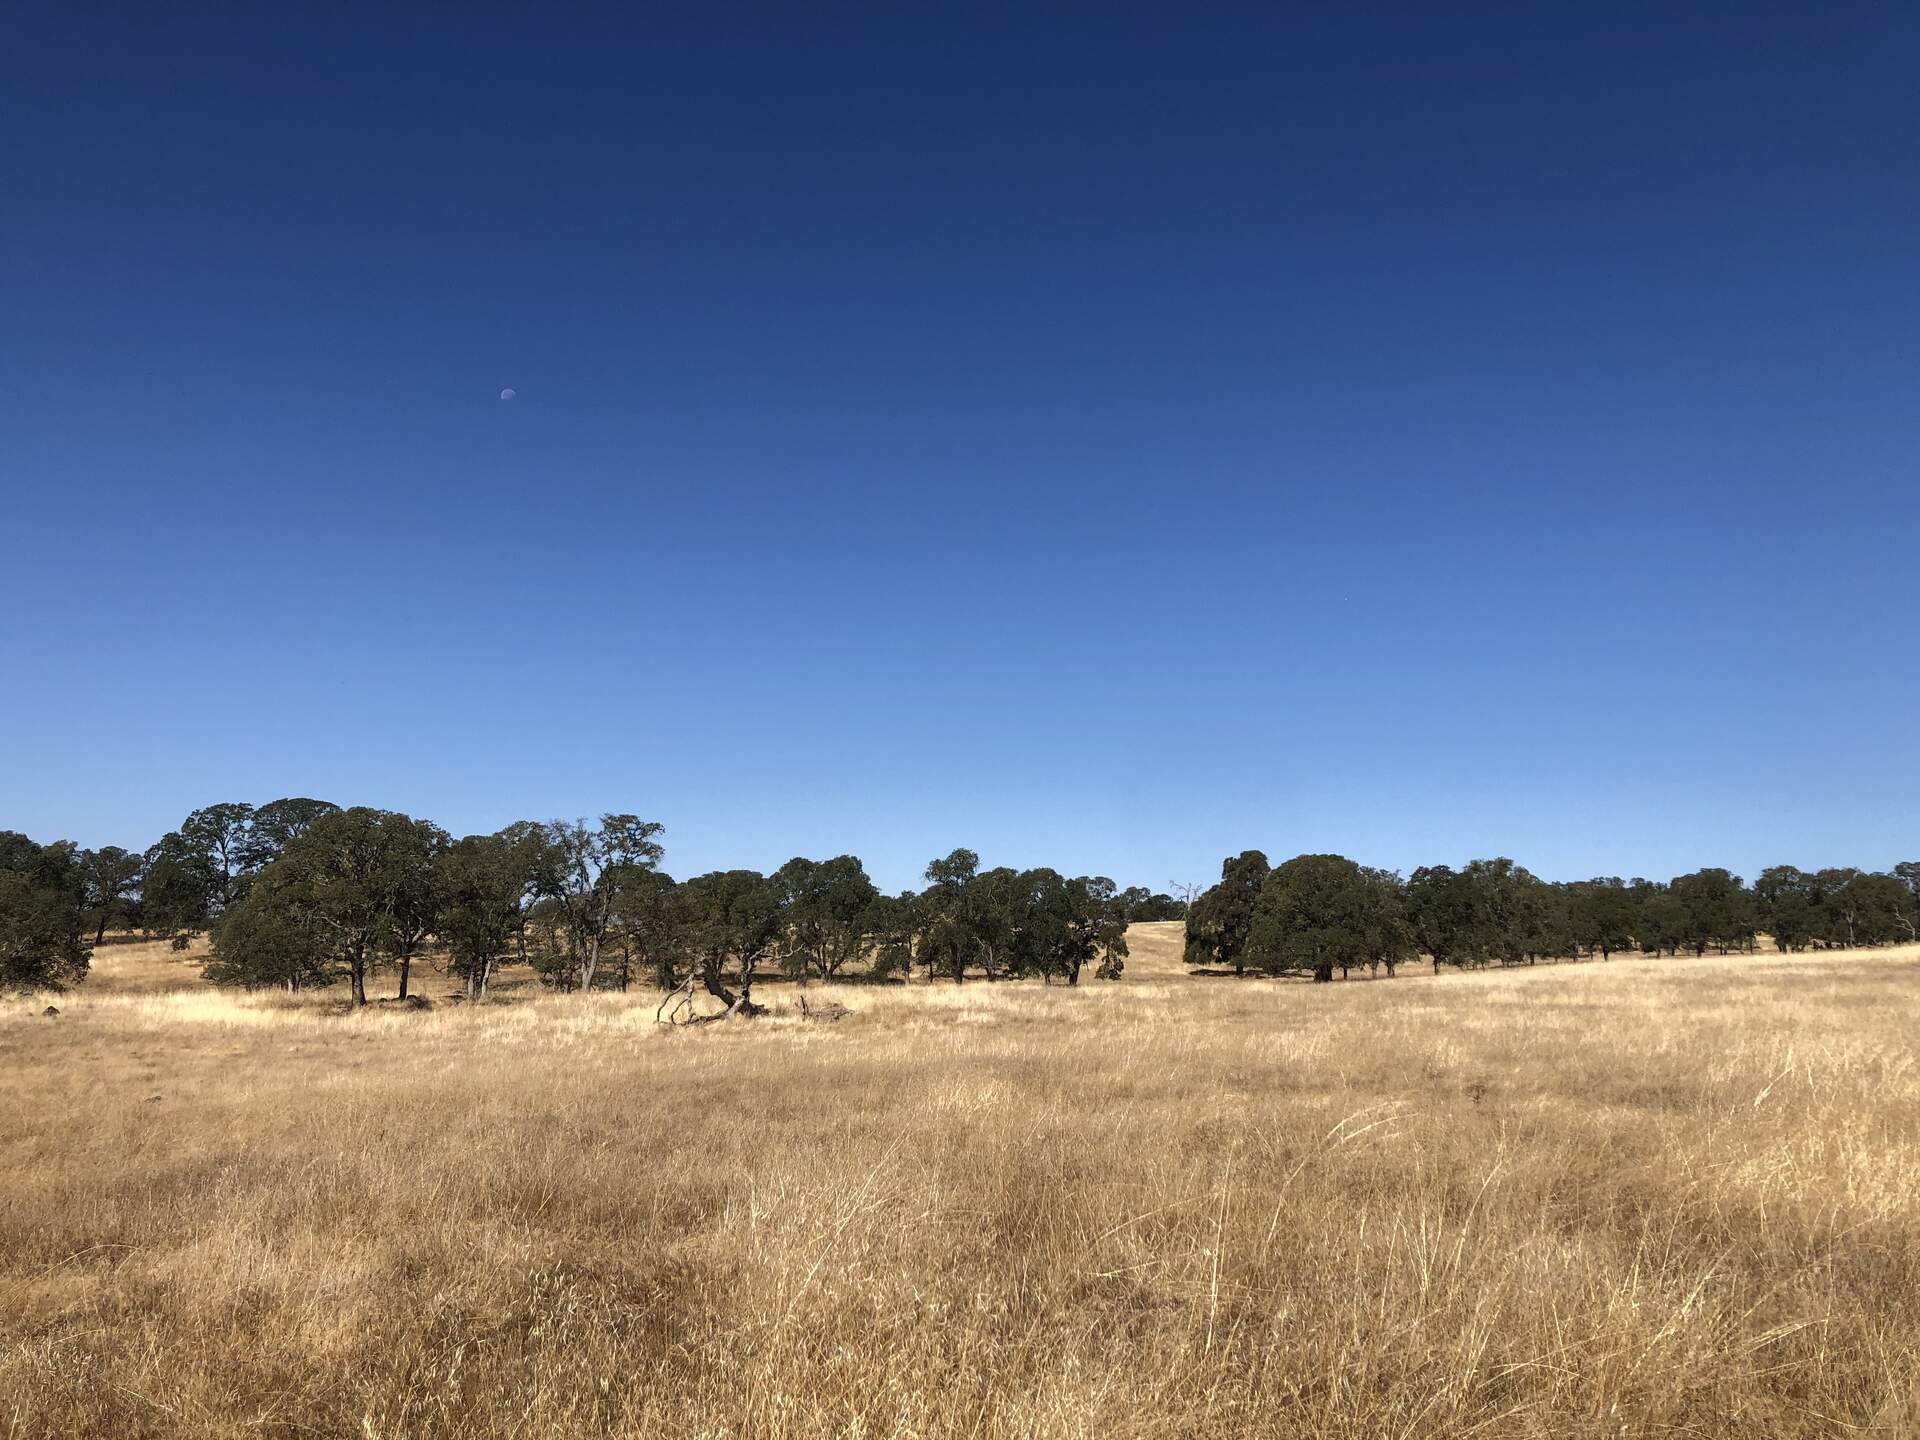
20231004VR_Moon.jpg ( 2023-10-04 11:07:26 ) Full size: 1920x1440
Waning moon and autumn phenology
9 sets found
16 VR_met graphs found
2 VR_flux graphs found
No data found for VR_soilco2.
2 VR_pond graphs found
Can't check TZVR_mixed
3 VR_fd graphs found
4 VR_processed graphs found
4 VR_arable graphs found
6 VR_soilvue graphs found