Field Notes
<--2023-07-24 11:35:00 | 2023-08-24 12:30:00-->Other sites visited today: Gilbert Tract | Mayberry | West Pond | East End | Bouldin Alfalfa
Phenocam link: Searching...
Bouldin Corn: 2023-08-08 14:50:00 (DOY 220)
Author: Daphne Szutu
Others: Robert
Summary: Regular data collection/cleaning, corn is tall with fat cobs, levee construction work continues
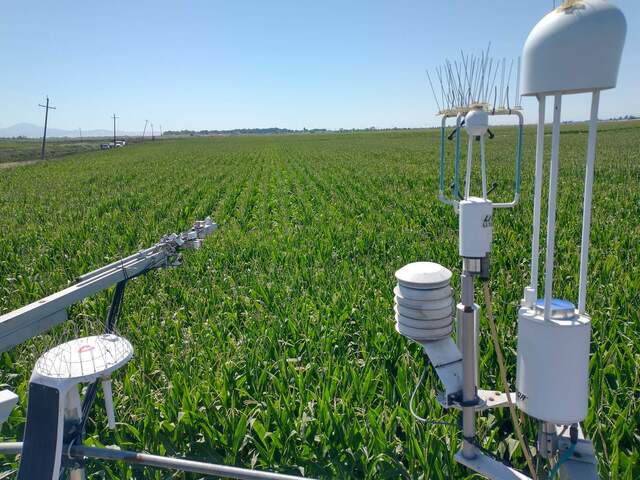
| 2023-08-08 Bouldin Corn Robert and I arrived at 14:50 PDT. It was breezy, sunny, and clear, with lots of construction traffic going back and forth. The corn looks more or less fully grown, tall with fat cobs. Robert took veg height samples and noted lots of loose pollen/dust inside the canopy. I downloaded the usual data: met, cam, USB GHG, PA, IRT and zcams. Zcam2 had lost its clock; I reset the clock, restarted the camera, and confirmed the clock was still good. We can probably remove the zcams at the next site visit. I changed the eddy clock +25sec from 14:18 to 14:18:25 PST to match the laptop clock and restarted logging. Robert cleaned flux and rad sensors. The reservoir was 70% full; Robert refilled it. I checked the phenocam clock as part of its routine check. I changed it +2min from 14:20 to 14:22 PST to match the laptop time and hit Apply to save the changes. I made sure to plug the network cable back into the NL115. Robert chatted up the construction worker driving the tractor. The worker was interested in whether the corn was fit for human consumption. The 7500 read: 394ppm CO2, 699mmol/m3 H2O, 30.1C, 101.3kPa, 92SS--99 after cleaning The 7700 read: 1.95ppm CH4, 35RSSI--76 after cleaning We left at 15:25 PDT. |
Veg Height (cm): Tape measure from ground to top of plant - Lots of loose pollen/dust inside canopy, fat cobs
271, 274, 272, 293, 275, 243, 261, 278, 284, 277, avg = 272.8, stdev = 13.4
1 photos found

20230808BC_MatureCorn.jpg ( 2023-08-08 15:15:00 ) Full size: 1920x1440
Corn looks fully developed
6 sets found
17 BC_met graphs found
5 BC_flux graphs found
Can't check TATWBABCSB_cam
Can't check MBSWEEWPBCBA
2 BC_pa graphs found
1 BC_arable graphs found

