Field Notes

<--2023-07-24 15:25:00 | 2023-08-23 14:40:00-->
Other sites visited today: Gilbert Tract | Mayberry | West Pond | Bouldin Corn | Bouldin Alfalfa
Phenocam link: Searching...

East End: 2023-08-08 14:10:00 (DOY 220)
Author: Daphne Szutu
Others: Robert

Summary: Regular data collection/cleaning, Decagon NDVI sensors tilted from bird activity

2023-08-08
East End

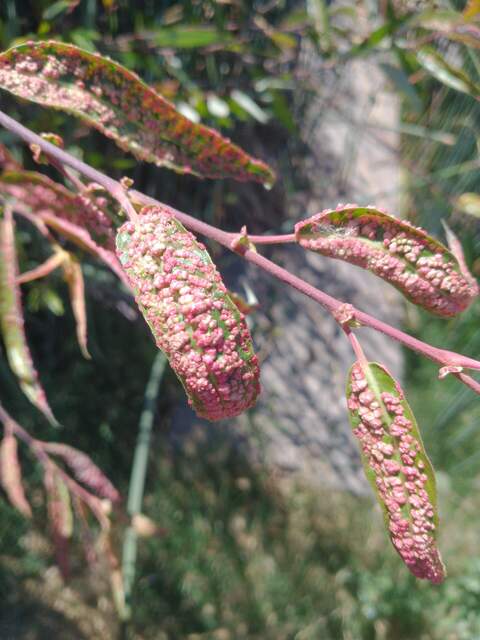
Robert and I arrived at 14:10 PDT. It was hot and sunny with a slight cooling breeze. The staff gauge read 73cm and the water surface was covered with duckweed. Robert noticed lots of leaf galls on the willow trees by our parking spot. Maybe half of the leaves were affected.

I downloaded met, cam, and USB GHG data. Robert cleaned flux and rad sensors and reported that the Decagon NDVI sensors were tilted and dirty, and the 4-way radiometer was covered in bird gunk (especially the LWin sensor). I think he straightened the Decagon NDVI sensors.

The 7500 read: 419ppm CO2, 801mmol/m3 H2O, 28.4C, 101.2kPa, 99SS--102 after cleaning
The 7700 read: 2.0ppm CH4, 53RSSI--84 after cleaning

We left at 14:25 PDT.

2 photos found

Leaf galls on willow tree by boardwalk. Maybe half of the tree
20230808EE_LeafGalls.jpg ( 2023-08-08 14:11:56 ) Full size: 1440x1920
Leaf galls on willow tree by boardwalk. Maybe half of the tree's leaves were affected, although most had fewer galls than the leaves in this photo.
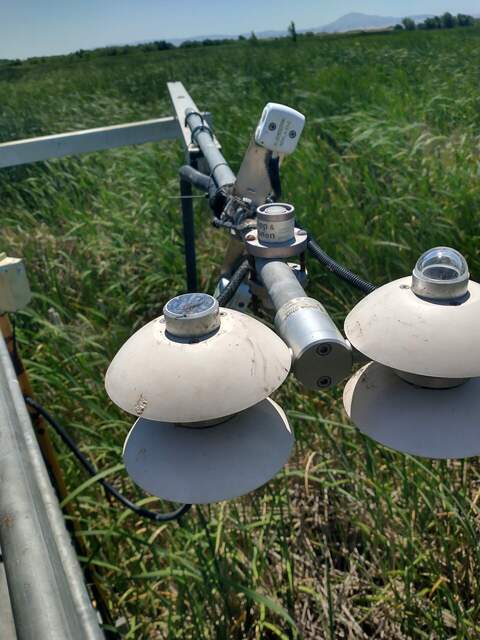
Decagon NDVI sensors were completely tilted, and there were feathers and some dried blood spots on the boom.
20230808EE_NdviTilt.jpg ( 2023-08-08 14:13:27 ) Full size: 1440x1920
Decagon NDVI sensors were completely tilted, and there were feathers and some dried blood spots on the boom.

Graphs display:
11 sets found

14 EE_met graphs found

Explore the graph:Temperature and Batt V in a new window

Explore the graph:Soil Moisture and Well Pressure in a new window

Explore the graph:Solar Radiation in a new window

Explore the graph:PAR in a new window

Explore the graph:Soil Heat Flux in a new window

Explore the graph:Water Level and Rain in a new window

Explore the graph:Soil/Water Temperature Set 1 in a new window

Explore the graph:Soil/Water Temperature Set 2 in a new window

Explore the graph:Soil/Water Temperature Set 3 in a new window

Explore the graph:Dissolved Oxygen and Wind Speed in a new window

Explore the graph:SRS NDVI Channels in a new window

Explore the graph:Apogee NDVI in a new window

Explore the graph:NDVI in a new window

Explore the graph:Undercanopy PAR in a new window

Can't check EE_mixed
1 EE_mixed graphs found

Explore the graph:Air Pressure and RH in a new window

8 EE_flux graphs found

Explore the graph:Wind Speeds in a new window

Explore the graph:LI7500 CO2 and H2O in a new window

Explore the graph:LI7700 CH4 and RSSI in a new window

Explore the graph:Flux Counts in a new window

Explore the graph:Instument Temperatures in a new window

Explore the graph:Temp Tower 3 (Mixed Veg) in a new window

Explore the graph:Temp Tower 3 (Mixed Veg) in a new window

Explore the graph:Temp Tower 3 (Mixed Veg) in a new window

Can't check MBWPEESWGT_mixed
1 EE_cam graphs found

Explore the graph:EE Autocam GCC in a new window

Can't check MBEEWPSWEPGT_cam
Can't check SIMBTWEE_met
Can't check EE_Temp
5 EE_Temp graphs found

Explore the graph:Sonic SOS in a new window

Explore the graph:LI7500 CO2 in a new window

Explore the graph:Water Level in a new window

Explore the graph:LI-7700 CH4 in a new window

Explore the graph:Wind Speed in a new window

Can't check EE_minidot
1 EE_minidot graphs found

Explore the graph:EE miniDOT Dissolved Oxygen in a new window

Can't check MBSWEEWPBCBA
1 EE_processed graphs found

Explore the graph:CO2 Fluxes in a new window