
Field Notes
<--2023-07-24 18:17:00 | 2023-08-23 10:00:00-->Other sites visited today: Mayberry | West Pond | East End | Bouldin Corn | Bouldin Alfalfa
Phenocam link: Searching...
Gilbert Tract: 2023-08-08 10:10:00 (DOY 220)
Author: Daphne Szutu
Others: Robert
Summary: Photographer visit, swapped 7500 and 7700 for calibration, checked conductivity with manual measurement
| 2023-08-08 Gilbert Tract Robert and I got to the channel at 10:10 PDT. It was a beautiful day, sunny and clear with good visibility and a cool breeze. The vegetation on the bank is getting dense (especially the Johnson grass(?)) that we couldn’t follow our usual route right along the edge of the bank and had to cut in a little. The tide was coming in and it was near high tide. I downloaded data from Flo, reset its clock, and restarted data logging. Around 10:20 PDT we went back to the main gate to meet Eric, a photographer with the East Bay Times/San Jose Mercury. He took photos while Robert and I serviced the tower. The staff gauge read 80cm at 10:20 PST. I downloaded met, cam, and USB GHG data. Robert cleaned flux and rad sensors. The reservoir was 90% full so we left it as is. There were a lot of ants around the met box and many ant carcasses inside the met box. I left some more mothballs in the box. We swapped the 7500 for calibration: sn 0065 came off and sn 75H-2669 went on. We also swapped the 7700 for calibration: sn TG1-0424 came off and sn TG1-0223 went on. Robert replaced the spiky 7700 hat and the wash nozzle after the swap. I changed the eddy clock +45sec from 9:53:15 to 9:54 PST to match the laptop time. I uploaded a new config file for the 7500, updated its pressure coefficients, and reset the box. I confirmed that the 7500 and 7700 were both ok/connected and the USB was logging. The 7700 thermocouple plug was not seated correctly in the cap. The temperature was ok but humidity is getting into optics cavity. I meant to check it before we left but forgot. Next time I need to bring a fresh drierite bottle and maybe a spare 7700 thermocouple plug. 0065 read: 410ppm CO2, 698mmol/m3 H2O, 21.3C, 101.2kPa, 101.8SS 0065 clean read: 414ppm CO2, 778mmol/m3 H2O, 21.5C, 101.2kPa, 106SS 75H-2669 fresh read: 410ppm CO2, 686mmol/m3 H2O, 21.7C, 101.2kPa, 102SS TG1-0424 read: 2.01ppm CH4, 61RSSI TG1-0424 clean read: 2.0ppm CH4, 81RSSI TG1-0223 fresh read: 1.98ppm CH4, 82RSSI The miniDOTs are due but I forgot my microUSB cable. Next time. Out on the boardwalk, I got in the water to check the Campbell conductivity sensor as part of its routine check. The orifice was clear. I also checked the conductivity with the hand-held probe. I tried to make the probe the same depth as the conductivity sensors. Temperature-compensated conductivity by the Campbell/METER conductivity sensors: 269.2 Millisemens at 22.9 deg C 265.8 Millisemens at 22.4 deg C Around 11:30 PDT, we drove down to the levee breach with Eric to show him the view. We all left around 11:45 PDT. |
1 photos found
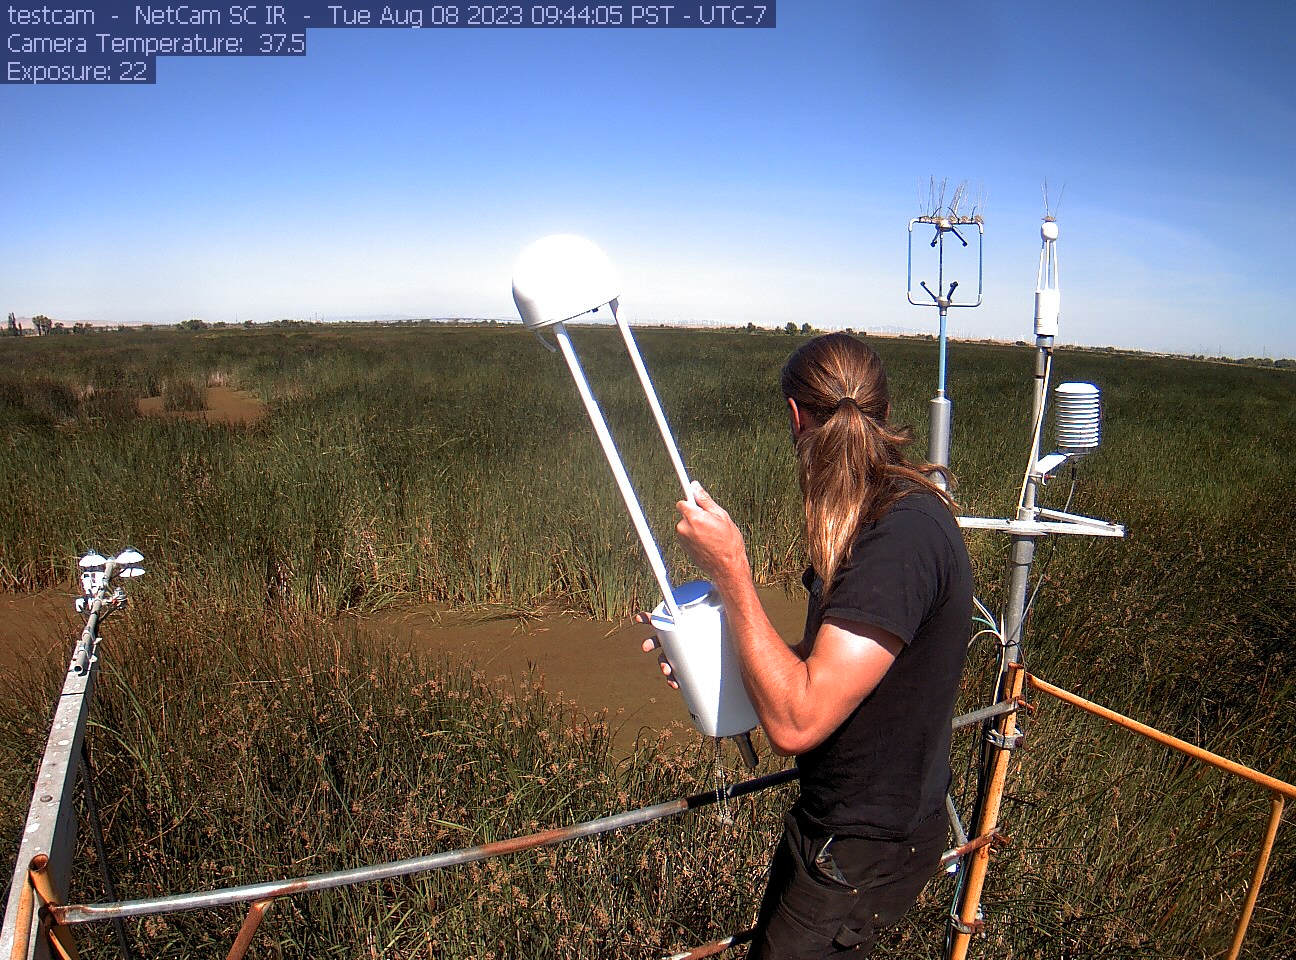
gilberttract_2023_08_08_094405.jpg ( 2023-08-08 17:47:56 ) Full size: 1296x960
Robert stealing the LI7700 (to swap it for calibration)
8 sets found
Can't check MBWPEESWGT_mixed
Can't check MBEEWPSWEPGT_cam
16 GT_met graphs found
4 GT_flux graphs found
3 GT_adcp graphs found
1 GT_cam graphs found
2 GT_usgs graphs found
No data found for GT_chanexo.