
Field Notes
<--2023-05-09 15:15:00 | 2023-05-31 18:25:00-->Other sites visited today: Gilbert Tract | Mayberry | West Pond | East End | Bouldin Corn | Bouldin Alfalfa
Phenocam link: Searching...
Hill Slough: 2023-05-17 15:10:00 (DOY 137)
Author: Daphne Szutu
Others: Robert
Summary: Regular data collection/cleaning, high tide, windy
| 2023-05-17 Hill Slough Robert and I arrived at 15:10 PDT. It was sunny and super windy. It was near high tide and the water level is pretty much the highest I've ever seen. The staff gauge read 6.1ft at 14:10 PST. North of the tower I think the elevation is a little higher so we could see a green algae mat on the water. By our tower and boardwalk, the usual green algae mat on the soil surface was completely covered. I downloaded met, cam, and USB GHG data. Robert cleaned flux and rad sensors. The reservoir was 80% full; we refilled it. I changed the eddy clock +50sec from 14:18 to 14:18:50 to match the laptop time and restarted logging afterwards. The 7500 read: 409ppm CO2, 720mmol/m3 H2O, 24.5C, 101.3kPa, 99SS--99.5 after cleaning The 7700 read: 1.95ppm CH4, 52RSSI-- 70 after cleaning We left at 15:25 PDT. |
1 photos found
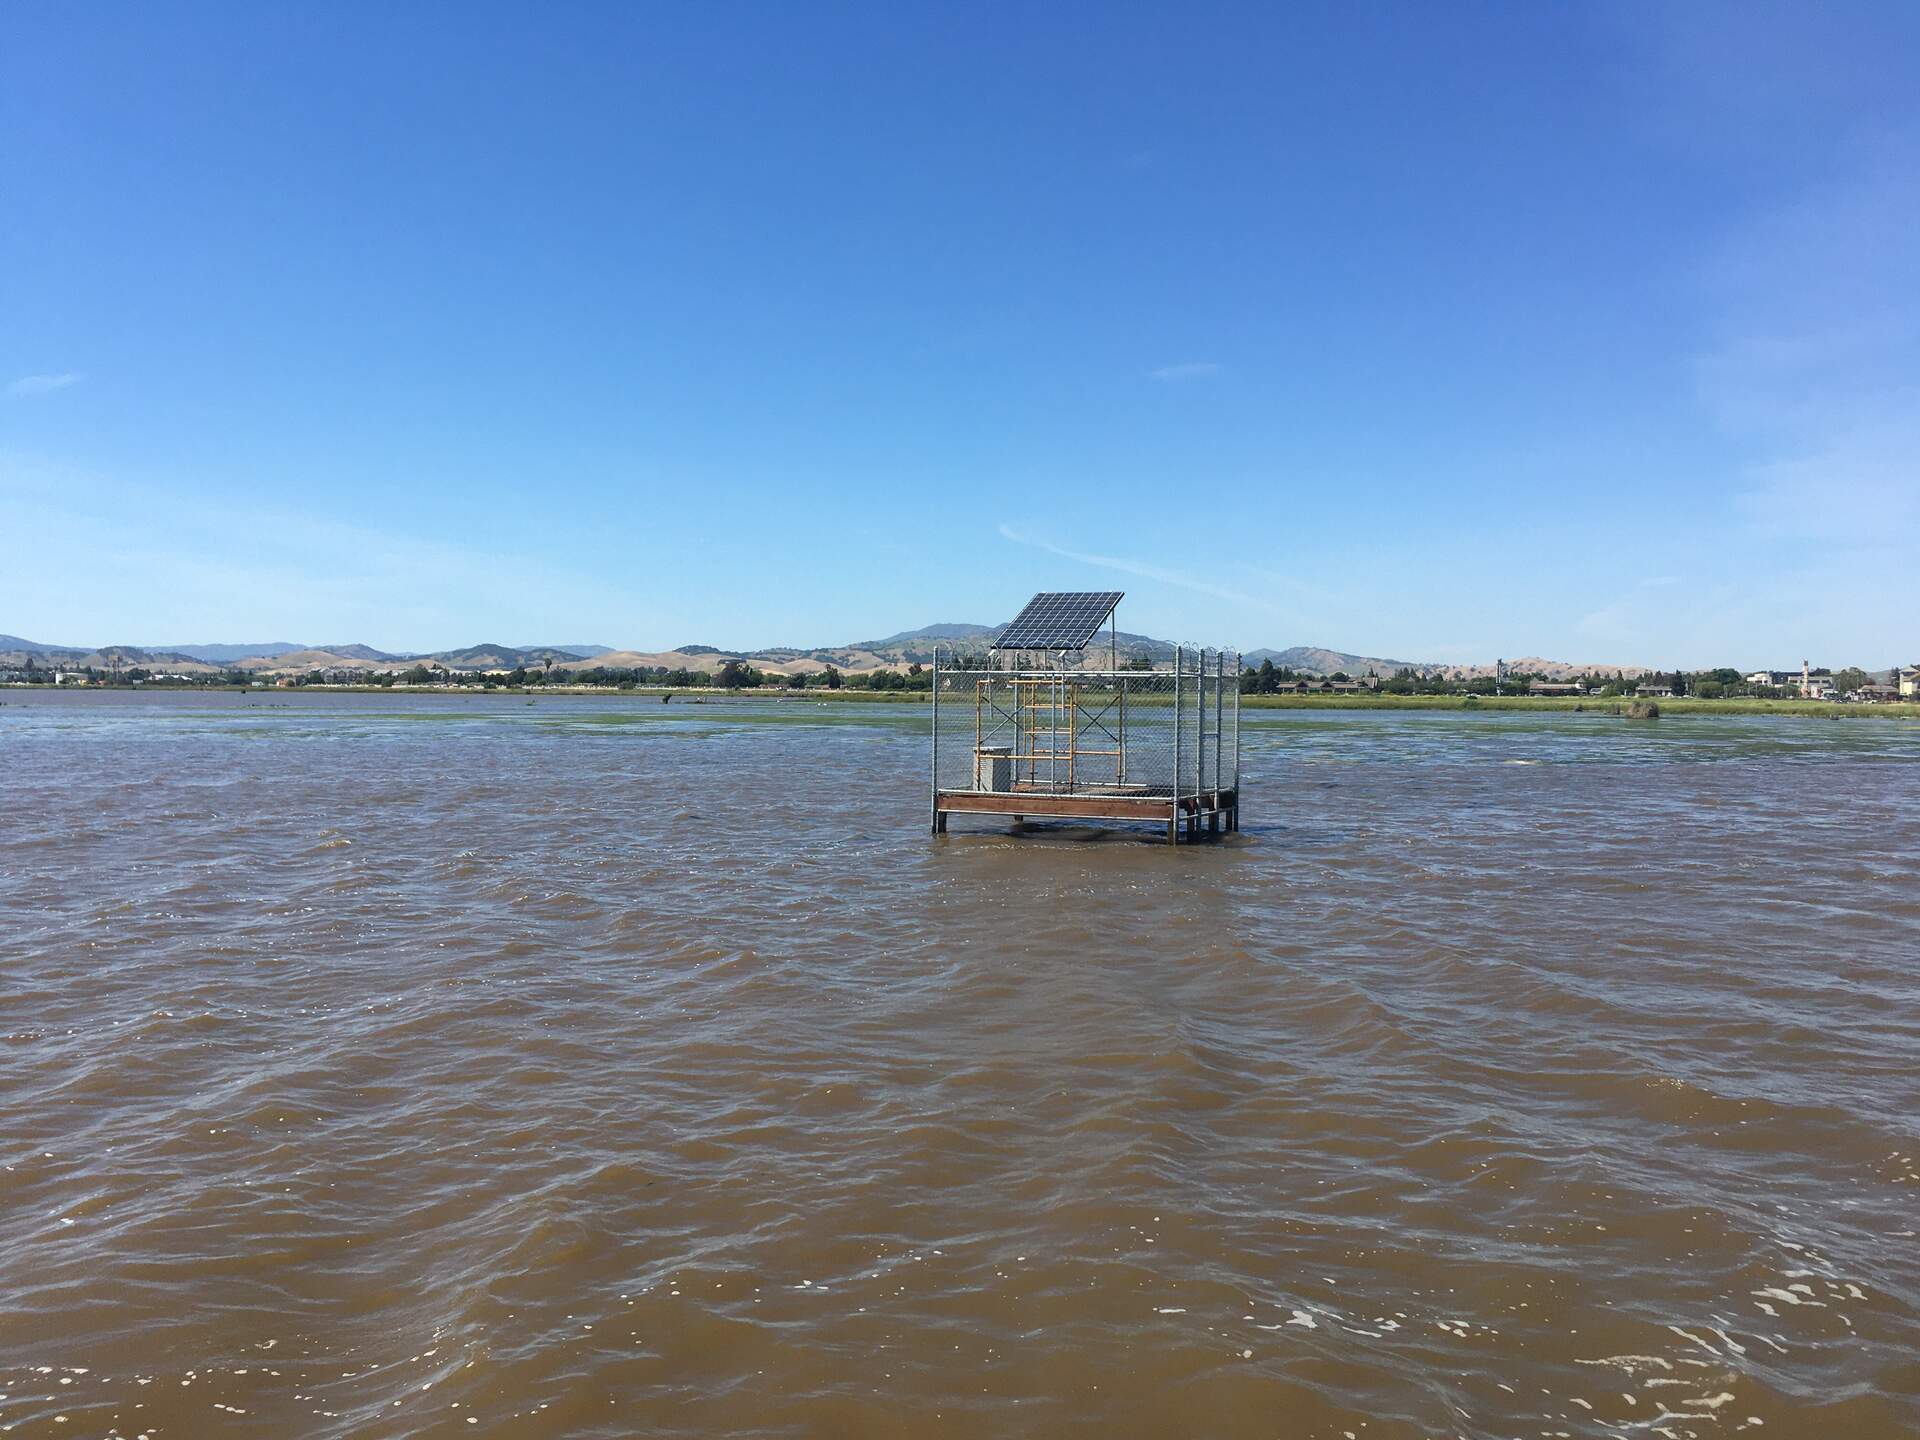
20230517HS_AlgaeMat.jpg ( 2023-05-17 15:25:05 ) Full size: 1920x1440
Green algae mat visible north of the solar tower during high tide
4 sets found
21 HS_met graphs found
4 HS_flux graphs found
1 HS_cam graphs found
Can't check HS_Processed
2 HS_Processed graphs found