Field Notes
<--2023-05-09 12:25:00 | 2023-05-31 15:55:00-->Other sites visited today: Gilbert Tract | Mayberry | West Pond | East End | Bouldin Alfalfa | Hill Slough
Phenocam link: Searching...
Bouldin Corn: 2023-05-17 12:55:00 (DOY 137)
Author: Daphne Szutu
Others: Robert
Summary: Regular data collection/cleaning, warm, field planted maybe, large caterpillar, no photos on camera card--needs work
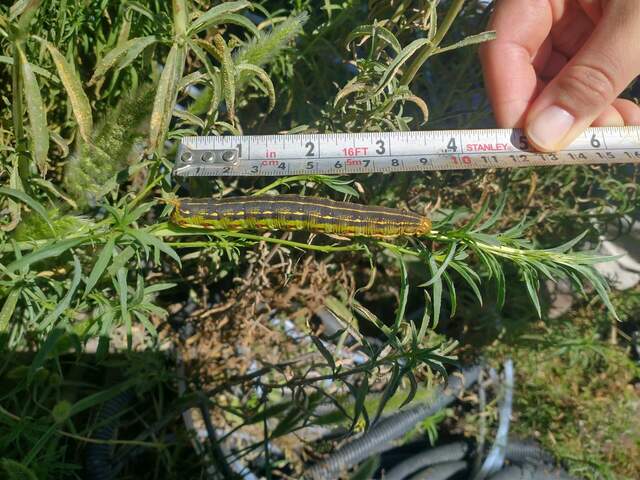
| 2023-05-17 Bouldin Corn Robert and I arrived at 12:55 PDT. It was warm and sunny with a warm breeze. The large truck that sprays water on the road passed us just as we arrived at the tower. The field looks like it's been planted (no furrows yet) but no sprouts coming up yet. Corn is coming up in the fields north of Hwy 12. I downloaded met, cam, USB GHG, PA, and IRT data. Robert cleaned flux and rad sensors. The reservoir was 3/4 full; we refilled it. The 7500 read: 406ppm CO2, 699mmol/m3 H2O, 29.2C, 101.2kPa, 100SS after cleaning The 7700 read: 1.96ppm CH4, 78RSSI after cleaning We left at 13:10 PDT. On our way out we spotted a few neon green caterpillars. Joe thinks they were sphinx moth caterpillars. An especially large one was waving about wildly and excreting a dark green goo. Back in the lab, there were no photos on the camera card. Recuva did not unearth any recent photos. I need to check the connection between the camera, the card reader, and the datalogger. |
1 photos found

20230517BC_Caterpillar.jpg ( 2023-05-17 13:22:48 ) Full size: 1920x1440
Several of these caterpillars were found on the edge of the BC field. The largest specimen was 9cm long! Joe thinks it's a sphinx moth caterpillars.
6 sets found
17 BC_met graphs found
5 BC_flux graphs found
Can't check TATWBABCSB_cam
Can't check MBSWEEWPBCBA
2 BC_pa graphs found
1 BC_arable graphs found

