
Field Notes
<--2022-03-31 18:25:00 | 2022-04-20 16:20:00-->Other sites visited today: Mayberry | West Pond | East End | Bouldin Corn | Bouldin Alfalfa | Hill Slough
Phenocam link: Searching...
Gilbert Tract: 2022-04-13 09:20:00 (DOY 103)
Author: Daphne Szutu
Others: Koong
Summary: Regular data collection/cleaning, no SL data from past 2 weeks--fixed?, swapped charge controller for SL, new SL deployment config, put up 2nd gamecam on taller post
| 2022-04-13 Gilbert Tract Koong and I arrived to the SL at 9:20 PDT. The tide was low and it was still ebbing. I couldn’t connect to the instrument even after a power cycle. We checked that the sensor dongle was receiving 13.4V from the charge controller and was outputting 13.4V to the sensor. Koong pulled the sensor out of the water. The measurement surfaces were fouled (especially the vertical sensor), so I wiped it clean with a rag. The sensor cable looked fine. I texted Joe and Ari about it, and we decided that the sensor was probably fine, but maybe there was some communication error. We arrived to the tower at 9:45 PDT. It was partly overcast, cool, and breezy with excellent visibility. Some of the tules by the tower have flowers. A field crew was doing more plant work in the southeast part of the parcel. At the tower, the water level was very low, but the ground around the tower was still soggy from recent irrigation. It had rained about 0.5mm on Monday and a bit more rain is expected this weekend and next week. I collected met, cam, and USB GHG data. Koong cleaned flux and rad sensors and topped off the wash reservoir. There were some dried spots (insect waste?) on the upper 77700 mirror that had to be scrubbed off. I changed the eddy clock +1min from 8:54 to 8:55 to match the laptop time and restarted logging. The miniDOT was barely in the water when we arrived, so I lowered it by chain links into the water. Any lower and I think it was hitting the ground. It was hard to see if the CTD sensor was in the water because of all the mosquito fern (azolla) covering the water surface. The depth data from the CTD sensor looks fine but there are some weird dips in the temperature time series. We will be re-arranging all the water sensors here after extending the boardwalk. I downloaded the videos from Ottercam North – not much to see. We installed Ottercam South again on a taller post. If we don’t get much we could use the gamecams at another site like MB or WP. We left the tower at 10:10 PDT and headed back to the SL to swap out the charge controller which I had forgotten to do initially. To my surprise, I could now connect to the sensor and download data. However, there was no data since 2022-03-31, which is weird because I remember Joe and I checked that the sensor was recording data after uploading a new config file. There was just 1 new line of data from the previous 15min. I think there was something wrong with the sensor in the last 2 weeks since sending the previous config and something was not working until the power cycles today. I sent a new deployment file (dated 20220412). This time it didn’t ask me to reset the site memory, but it did ask if I wanted to calibrate the atmospheric pressure sensor. I wasn’t sure what was involved in that so I declined. I disconnected from the sensor and pulled its power. We swapped the charge controller for a smaller one, sn 03220377 (15A) came off and sn 21501243 (6A) went on. I checked the voltages before plugging in the sensor and started logging data. LI-7500 readings: CO2 414ppm H2O 350ppm T 12.6C P 102.4kPa SS 98 --> 98 after cleaning LI7700 readings: CH4 2.07ppm RSSI 35 --> 81 after cleaning We left around 10:50 PDT. |
2 photos found

20220413GT_FoulingFront.jpg ( 2022-04-13 09:32:06 ) Full size: 1920x1440
Fouling on front of Side-Looker. 6 weeks since previous cleaning.
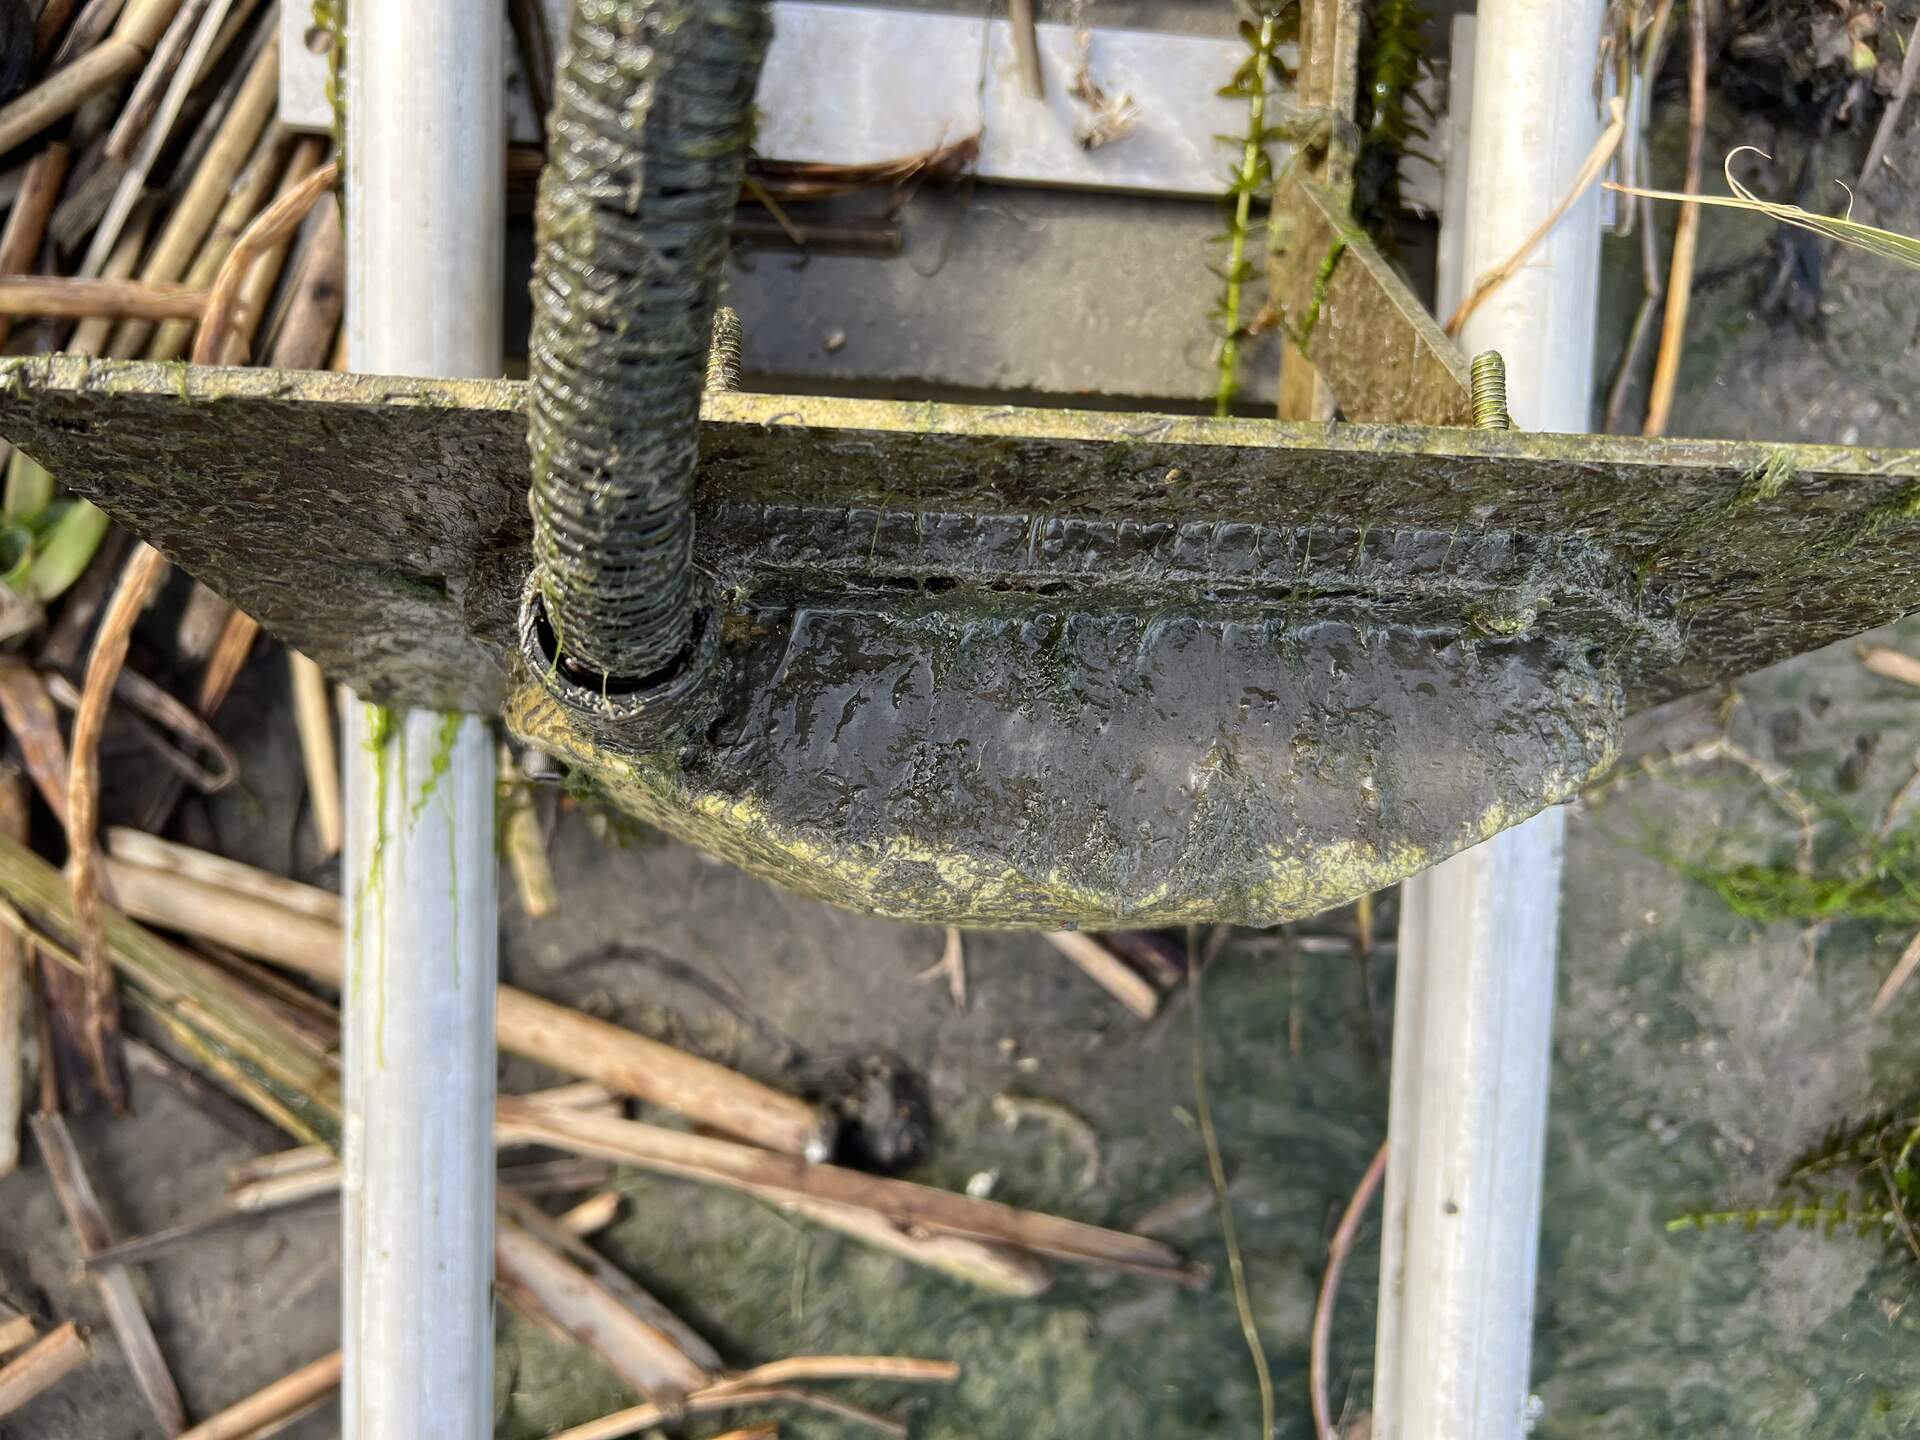
20220413GT_FoulingTop.jpg ( 2022-04-13 09:32:02 ) Full size: 1920x1440
Fouling on top of Side-Looker. 6 weeks since previous cleaning.
8 sets found
Can't check MBWPEESWGT_mixed
Can't check MBEEWPSWEPGT_cam
16 GT_met graphs found
4 GT_flux graphs found
3 GT_adcp graphs found
1 GT_cam graphs found
2 GT_usgs graphs found
No data found for GT_chanexo.