Field Notes
<--2021-06-16 10:50:00 | 2021-07-06 16:40:00-->Other sites visited today: Hill Slough | Bouldin Corn | East End | West Pond | Mayberry | Sherman Wetland
Phenocam link: Searching...
Bouldin Alfalfa: 2021-06-22 12:45:00 (DOY 173)
Author: Daphne Szutu
Others: Dennis, Ariane
Summary: Regular data collection/cleaning, spectral, veg height, downloaded IRT data, changed stardot clock +3min
| 2021-06-22 Bouldin Alfalfa Dennis, Ariane, and I arrived at 12:45 PDT. It was a breezy and sunny day with good visibility. Dennis declared it the "perfect day for spectroscopy! No clouds, nothing! It's perfect!" The alfalfa bales have been collected, and the alfalfa is flowering and about knee high. Dennis took spectral and veg height measurements. Ari cleaned flux and rad sensors. I downloaded met, camera, and USB GHG data. I downloaded the FD data and cleared its memory. The wash reservoir was mostly full. I also downloaded the IRT files by moving them from the microSD card to the laptop. Next time I’ll use the LoggerNet utility CardConvert to convert them from binary to TOA5 format. I inserted the microSD card back into the IRT datalogger and waited a few seconds until the Activity LED had 1 slow blink. The eddy clocks looked ok. I changed the stardot clock from 11:59 to 12:02 to match the laptop time. LI-7500 readings: CO2 411ppm H2O 668ppm T 25.1C P 101.3kPa SS 99--> 101 after cleaning LI7700 readings: CH4 1.9 RSSI 45--> 88 after cleaning We left at 13:05 PDT. |
Next Mowing: 2021-06-25
Veg Height (cm): Tape measure from ground to top of plant - Alfalfa flowering
56, 61, 58, 58, 55, 56, 37, 47, 59, 39, 54, 56, 46, 41, 51, 53, avg = 51.7, stdev = 7.48
1 photos found

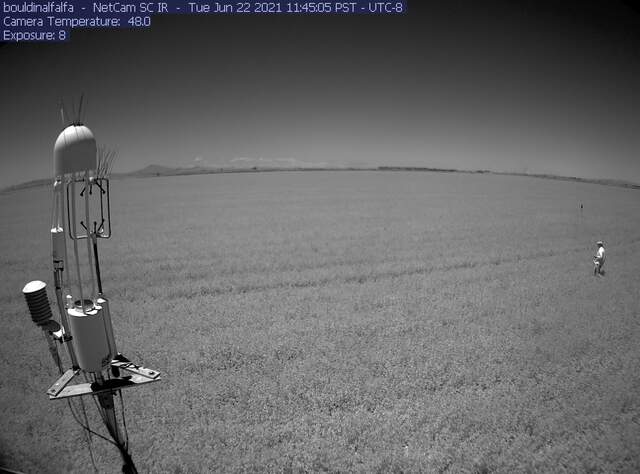
bouldinalfalfa_IR_2021_06_22_114505.jpg ( 2021-06-22 11:48:54 ) Full size: 1296x960
Dennis taking spectral measurements
7 sets found
5 BA_flux graphs found
21 BA_met graphs found
6 BA_arable graphs found
Can't check TATWBABCSB_cam
Can't check MBSWEEWPBCBA
2 BA_processed graphs found
No data found for BA_adex.

