Field Notes

<--2021-06-09 09:45:00 | 2021-07-06 10:50:00-->
Other sites visited today: Hill Slough | Bouldin Alfalfa | Bouldin Corn | East End | West Pond | Mayberry

Sherman Wetland: 2021-06-22 16:10:00 (DOY 173)
Author: Daphne Szutu
Others: Dennis, Ariane

Summary: Regular data collection/cleaning, changed Stardot clock +3min

2021-06-22
Sherman Wetland

Dennis, Ariane, and I arrived at 16:10 PDT. It was a windy and mild day with good visibility. The staff gauge read 99cm and it needs a good scrubbing next time when I’m wearing waterproof boots.

I downloaded met, camera, and USB GHG data. Ari cleaned flux and rad sensors. The wash reservoir was mostly full; we did not top it off.

I changed the stardot clock from 15:19 to 15:21 to match the laptop time. The eddy clock looked ok.

LI-7500 readings:
CO2 410ppm
H2O 655ppm
T 22.8C
P 101kPa
SS 99--> 101 after cleaning
LI7700 readings:
CH4 1.98ppm
RSSI 42--> 81 after cleaning

We left at 16:25 PDT.

1 photos found

Ari cleaning sensors
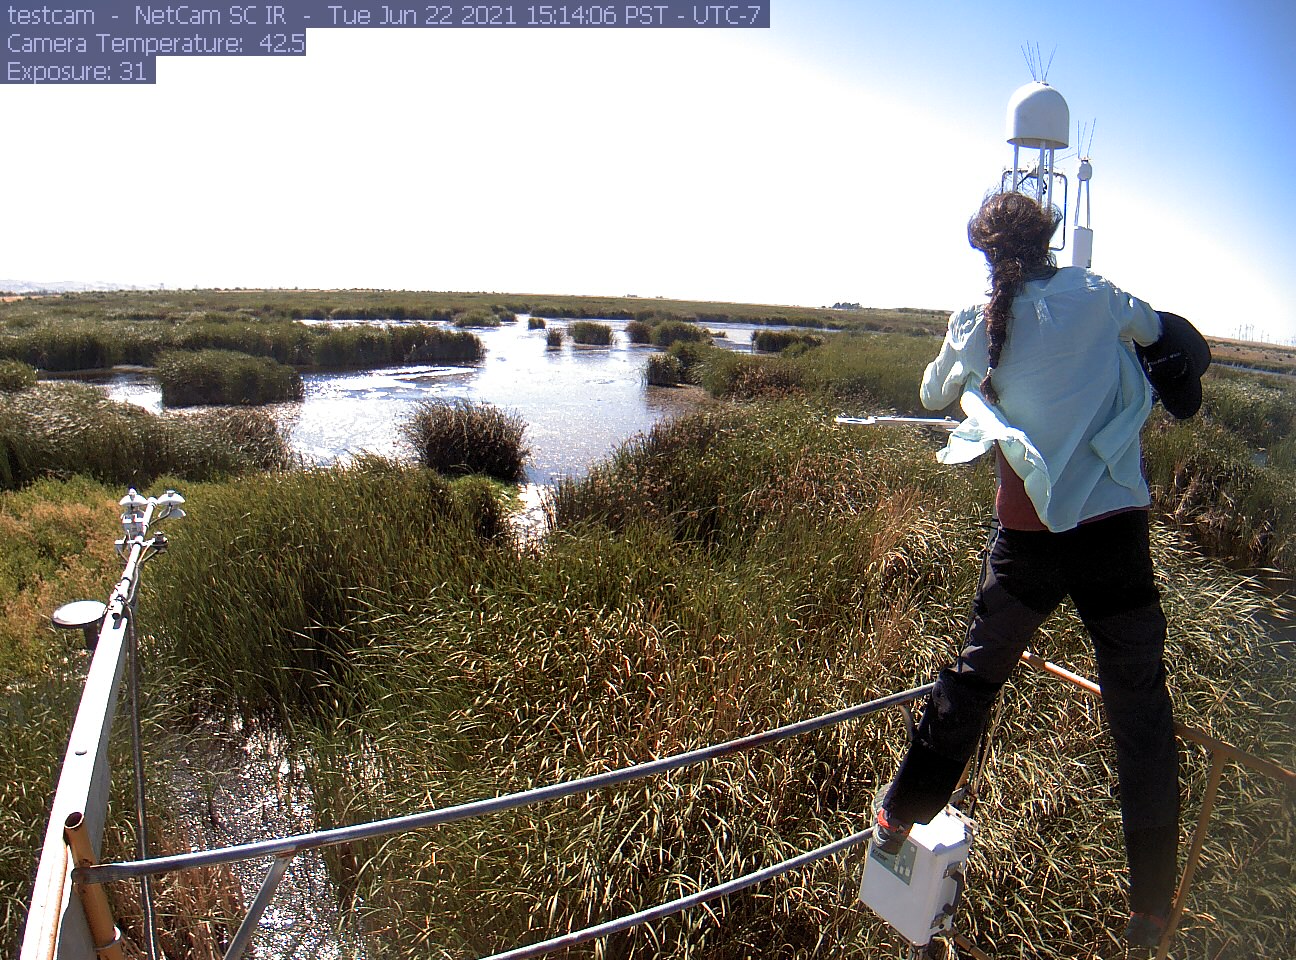
siwetland_2021_06_22_151406.jpg ( 2021-06-22 15:16:52 ) Full size: 1296x960
Ari cleaning sensors

Graphs display:
7 sets found

Can't check MBWPEESWGT_mixed
Can't check MBEEWPSWEPGT_cam
16 SW_met graphs found

Explore the graph:Temperatures in a new window

Explore the graph:Water Temperature Profile A in a new window

Explore the graph:Water Temperature Profile B in a new window

Explore the graph:Soil Temperature Profile C2 in a new window

Explore the graph:Soil Heat Flux in a new window

Explore the graph:Four channel Radiometer in a new window

Explore the graph:Sherman Wetland PAR in a new window

Explore the graph:PRI Channels in a new window

Explore the graph:NDVI Channels in a new window

Explore the graph:Water level and Rain in a new window

Explore the graph:Dissolved CO2 in a new window

Explore the graph:Air Pressure in a new window

Explore the graph:Battery Voltage and RH in a new window

Explore the graph:Soil Temperature Profile C1 in a new window

Explore the graph:SRS NDVI and PRI in a new window

Explore the graph:SW miniDOT Dissolved Oxygen in a new window

4 SW_flux graphs found

Explore the graph:CO2 and H2O in a new window

Explore the graph:Wind in a new window

Explore the graph:Methane in a new window

Explore the graph:Data Counts in a new window

Can't check MBSWEEWPBCBA
Can't check SW_Temp
14 SW_Temp graphs found

Explore the graph:Temperatures in a new window

Explore the graph:CO2 and H2O in a new window

Explore the graph:Wind in a new window

Explore the graph:Methane in a new window

Explore the graph:Data Counts in a new window

Explore the graph:Temperature Profile A in a new window

Explore the graph:Temperature Profile B in a new window

Explore the graph:Temperature Profile C in a new window

Explore the graph:Soil Heat Flux in a new window

Explore the graph:Four-channel radiometer in a new window

Explore the graph:NDVI Channels in a new window

Explore the graph:PAR in a new window

Explore the graph:Air Pressure and Water Level in a new window

Explore the graph:Air T and RH in a new window

3 SW_arable graphs found

Explore the graph:Incoming Solar Bands in a new window

Explore the graph:Reflected Solar Bands in a new window

Explore the graph:Solar Radiation in a new window