Field Notes
<--2020-11-19 14:05:00 | 2020-12-16 12:50:00-->Other sites visited today: Bouldin Alfalfa | Bouldin Corn | West Pond | Mayberry | Sherman Wetland
Phenocam link: Searching...
East End: 2020-12-03 13:10:00 (DOY 338)
Author: Daphne Szutu
Others: Camilo
Summary: Regular data collection/cleaning, swapped 7500 for calibration, adjusted eddy clock -7min, moved SHF plates to new channel to avoid gaps, tested precip bucket--needs more testing
| 2020-12-03 East End Camilo and I arrived at 13:10 PST. It was a mild, sunny, and still day. We’re now into month 9 of coronavirus shelter-in-place. The wetland is all brown. The staff gauge read 23cm. The water sensors were all in the water, and the conductivity sensor looked clean. The reservoir was empty; we refilled it but I forgot to test the wash afterwards. I downloaded met, cam, USB, and miniDOT data. I swapped the miniDOT and WL sensor desiccant. Camilo cleaned flux and rad sensors. Since SHFP1 has been having many gaps, I moved it to a new mux channel. I uploaded a new CR1000 program with 2 changes: the new SHFP1 mux channel, and a flag to throw out NAN values from the Apogee 30-min values. We swapped the LI-7500 for calibration: sn 1594 came down and sn 0041 went up. I uploaded a new config file, updated the pressure coefficients, and reset the box. There was a 7700 time sync error. I checked the 7550 clock and reset it from 13:53 to 13:46. This 7550 tends to run fast. I reset the box again and all seemed ok. I added a quick disconnect for the precip bucket, and we tested the precip bucket sn 50229-112 with 473ml of water. We poured in only half of the water at a time so that there was less pressure head change from start to finish, slowing the drip rate. We got 110 tips; last time we got 104 tips when we poured in the whole water amount at one time into the dripper bottle. We did not adjust the bucket. We need to think more about metering the dripping water before being confident in our calibration. LI-7500 readings (sn 1594 --> sn 1594 after cleaning --> sn 0041): CO2 352ppm --> 428 --> 445 42H2O 1038ppm (seems high) --> 420 --> 270 (seems low) T 20.7C --> 20.6 --> 21.8 P 102.3kPa --> 102.3 --> 102.3 SS 78--> 95 --> 101 LI7700 readings: CH4 2.4ppm RSSI 45-->81 after cleaning We left at 13:50 PST. |
1 photos found

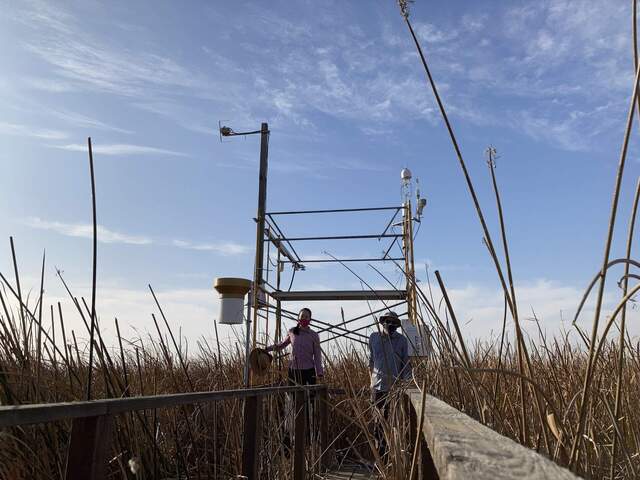
20201203EE_Tower.jpg ( 2020-12-03 13:50:48 ) Full size: 1920x1440
Daphne and Camilo on site
11 sets found
14 EE_met graphs found
Can't check EE_mixed
1 EE_mixed graphs found
8 EE_flux graphs found
Can't check MBWPEESWGT_mixed
1 EE_cam graphs found
Can't check MBEEWPSWEPGT_cam
Can't check SIMBTWEE_met
Can't check EE_Temp
5 EE_Temp graphs found
Can't check EE_minidot
1 EE_minidot graphs found
Can't check MBSWEEWPBCBA
1 EE_processed graphs found

