
Field Notes
<--2020-12-01 08:45:00 | 2020-12-09 12:30:00-->Other sites visited today: Bouldin Alfalfa | Bouldin Corn | East End | West Pond | Sherman Wetland
Phenocam link: Searching...
Mayberry: 2020-12-03 15:15:00 (DOY 338)
Author: Daphne Szutu
Others: Camilo
Summary: Regular data collection/cleaning, water samples for Isabel, fluorometer brushes seem fine, couldn't find fluorometer cap
| 2020-12-03 Mayberry Camilo and I arrived at 15:15 PST. It was a hazy and still day. We’re now into month 9 of coronavirus shelter-in-place. The staff gauge read 27cm. I remember seeing mostly brown reeds from the levee road driving in, but from the camera photos it looks mostly green-yellow. Camilo got in the water with waders to try to pick up the fluorometer cap I dropped last time, but couldn’t find it. The cap shouldn’t affect the readings one or another, but it was a convenient way to ensure the lenses stayed out of the mud. I checked the fluorometer brush locations before and after a cleaning cycle. Both times the brushes were well clear of the lenses. Looking at the data, there are some short periods in the last 2 weeks where the fluorometer data look normal and not noisy. It’s possible sometimes the brushes stop in different positions. I downloaded met, cam, USB, and miniDOT data. I swapped the miniDOT and water level sensor desiccant. The wash reservoir was ½ full; we refilled it. I collected 2 water samples for Isabel at 15:20 PST. I need to find more 20ml vials for her samples. Camilo cleaned flux and rad sensors. The lower 7700 mirror was generally dusty, although the edges were relatively clean. LI-7500 readings: CO2 442ppm H2O 431ppm T 16.9C P 102.2kPa SS 98-->101 after cleaning LI7700 readings: CH4 2.4ppm RSSI 40--> 85 after cleaning We left at 16:00 PST. At the end of the site visit I dropped my sunglasses in the water by the eddy post but didn't realize until we got back to campus. |
7 photos found
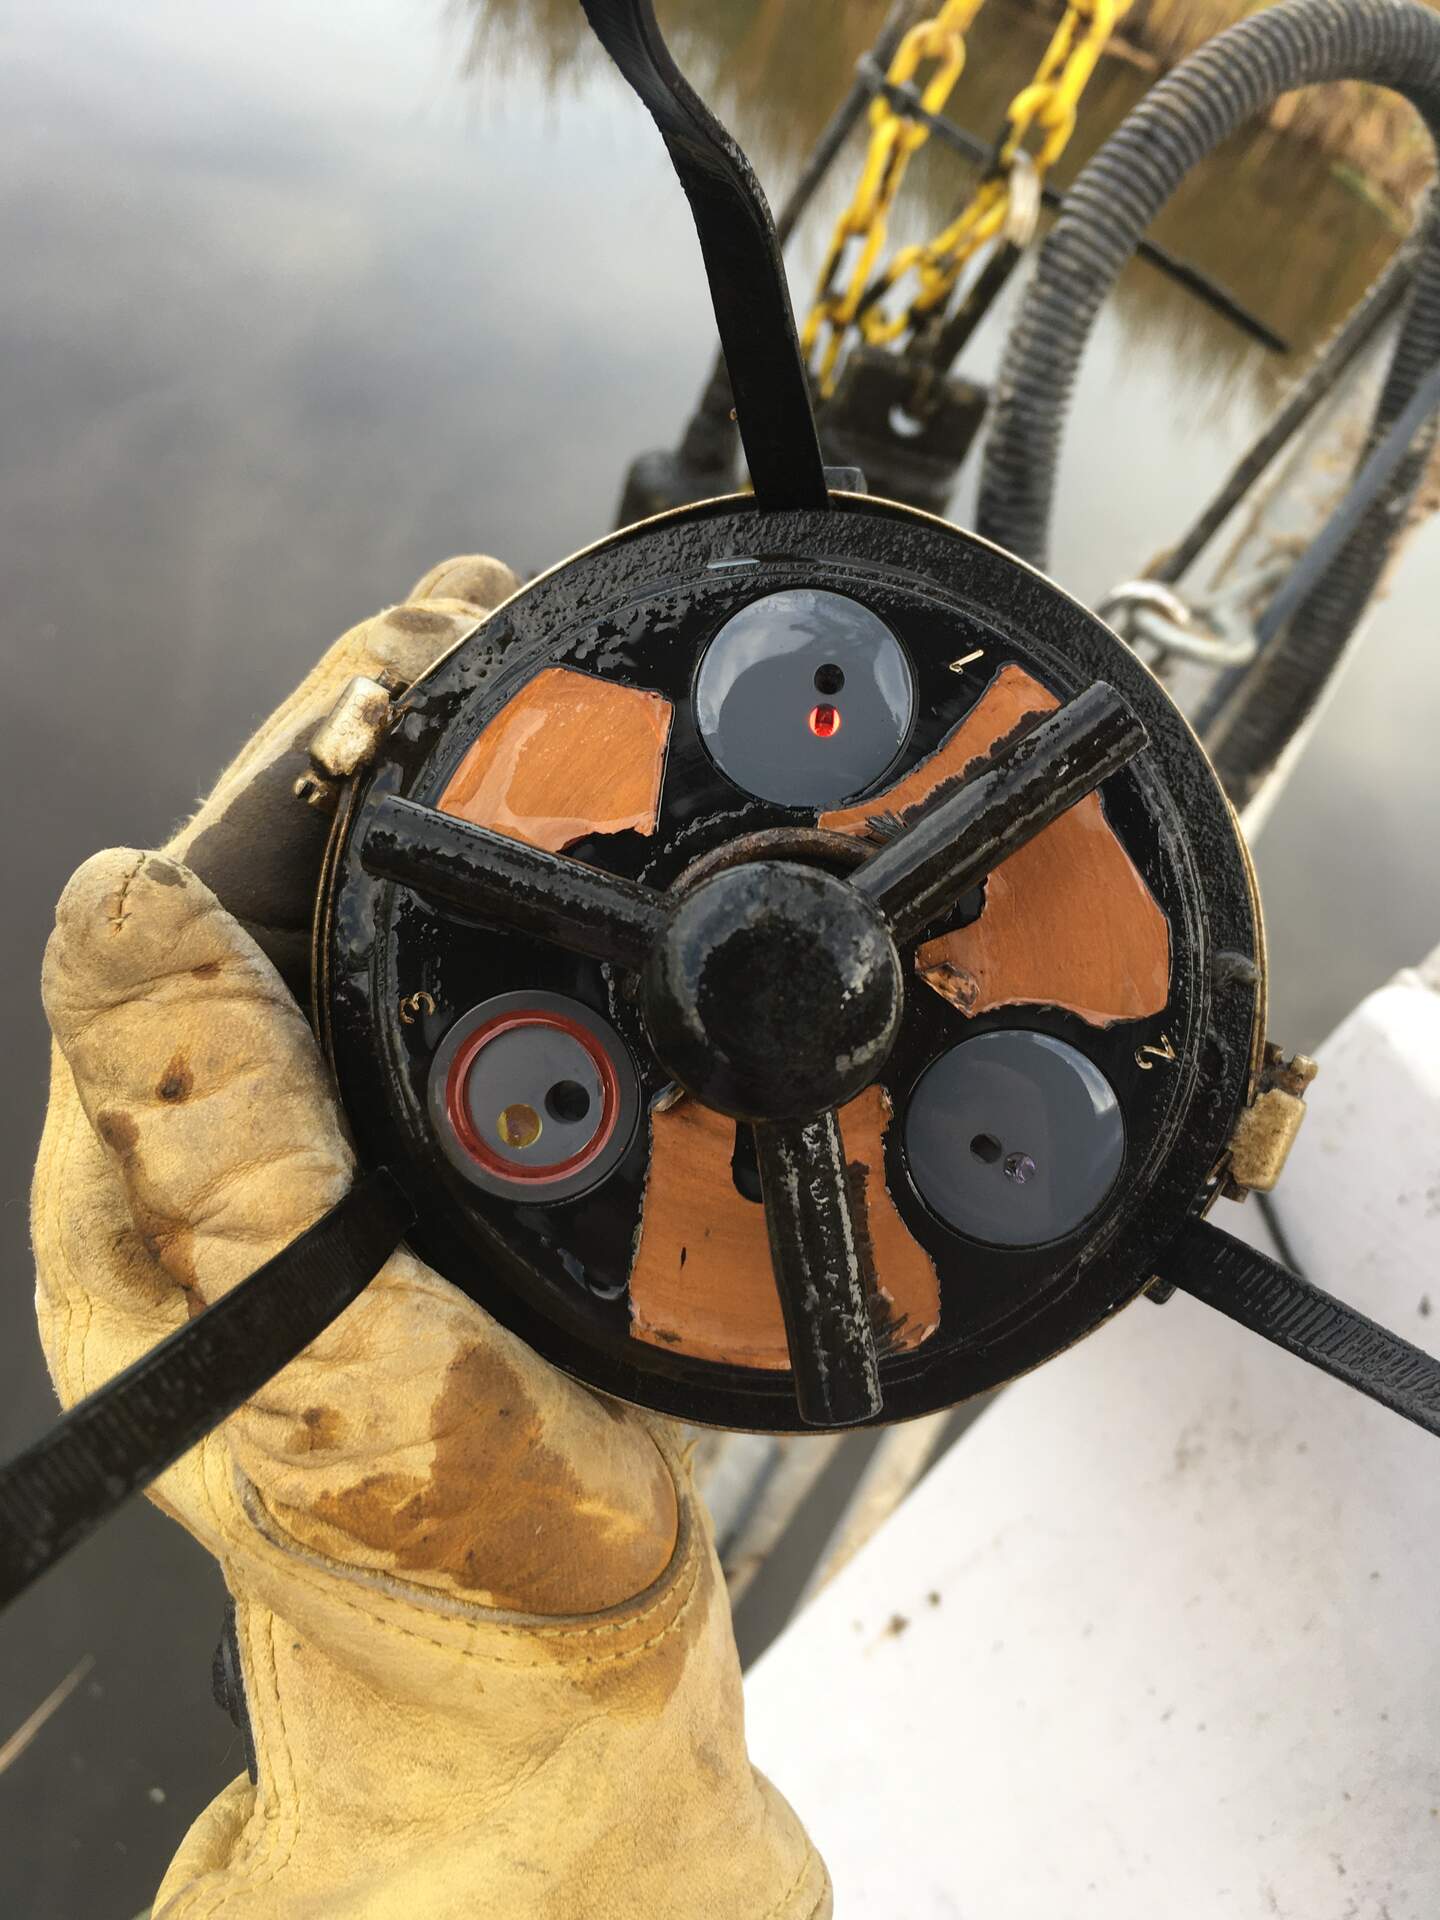
20201203MB_FluorometerBrushes.jpg ( 2020-12-03 15:40:55 ) Full size: 1440x1920
Brushes before and after cleaning cycle were clear of lenses, so not sure why data has been noisy

20201203MB_HazySky.jpg ( 2020-12-03 15:53:57 ) Full size: 1920x1024
Clouds reflected in still waters

MB_autocam_20201203_1245.jpg ( 2020-12-03 12:45:02 ) Full size: 1920x1440
Tail feathers from bird sitting atop camera enclosure
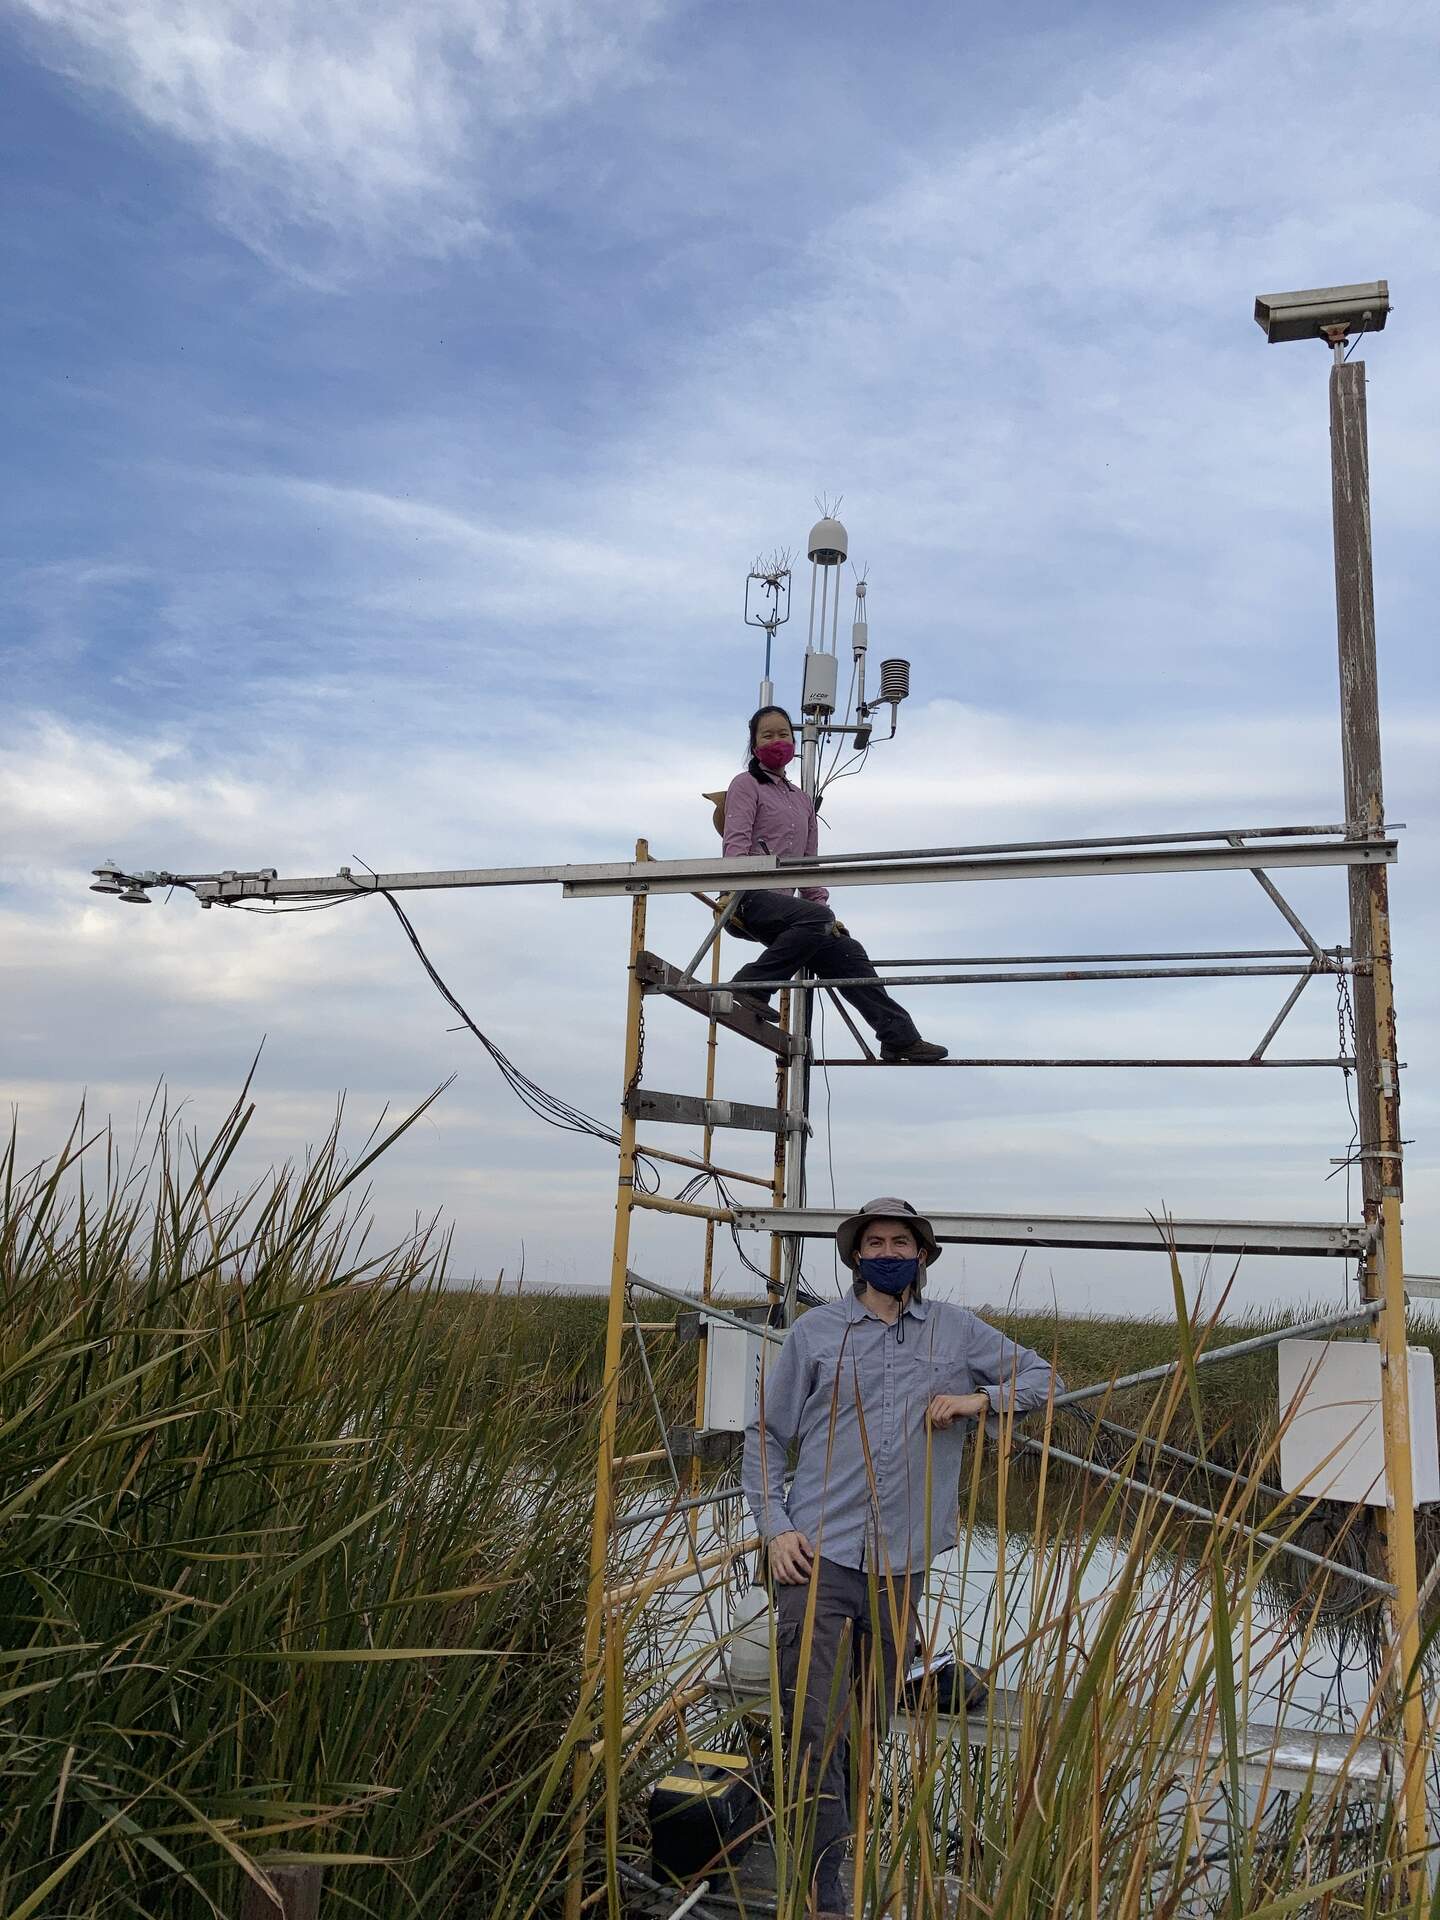
20201203MB_Tower.jpg ( 2020-12-03 15:53:32 ) Full size: 1440x1920
Daphne and Camilo on site

20201203MB_FluxSensors.jpg ( 2020-12-03 15:43:19 ) Full size: 1920x1440
Flux and HMP sensors

20201203MB_HMP.jpg ( 2020-12-03 15:49:40 ) Full size: 1440x1920
HMP sensor
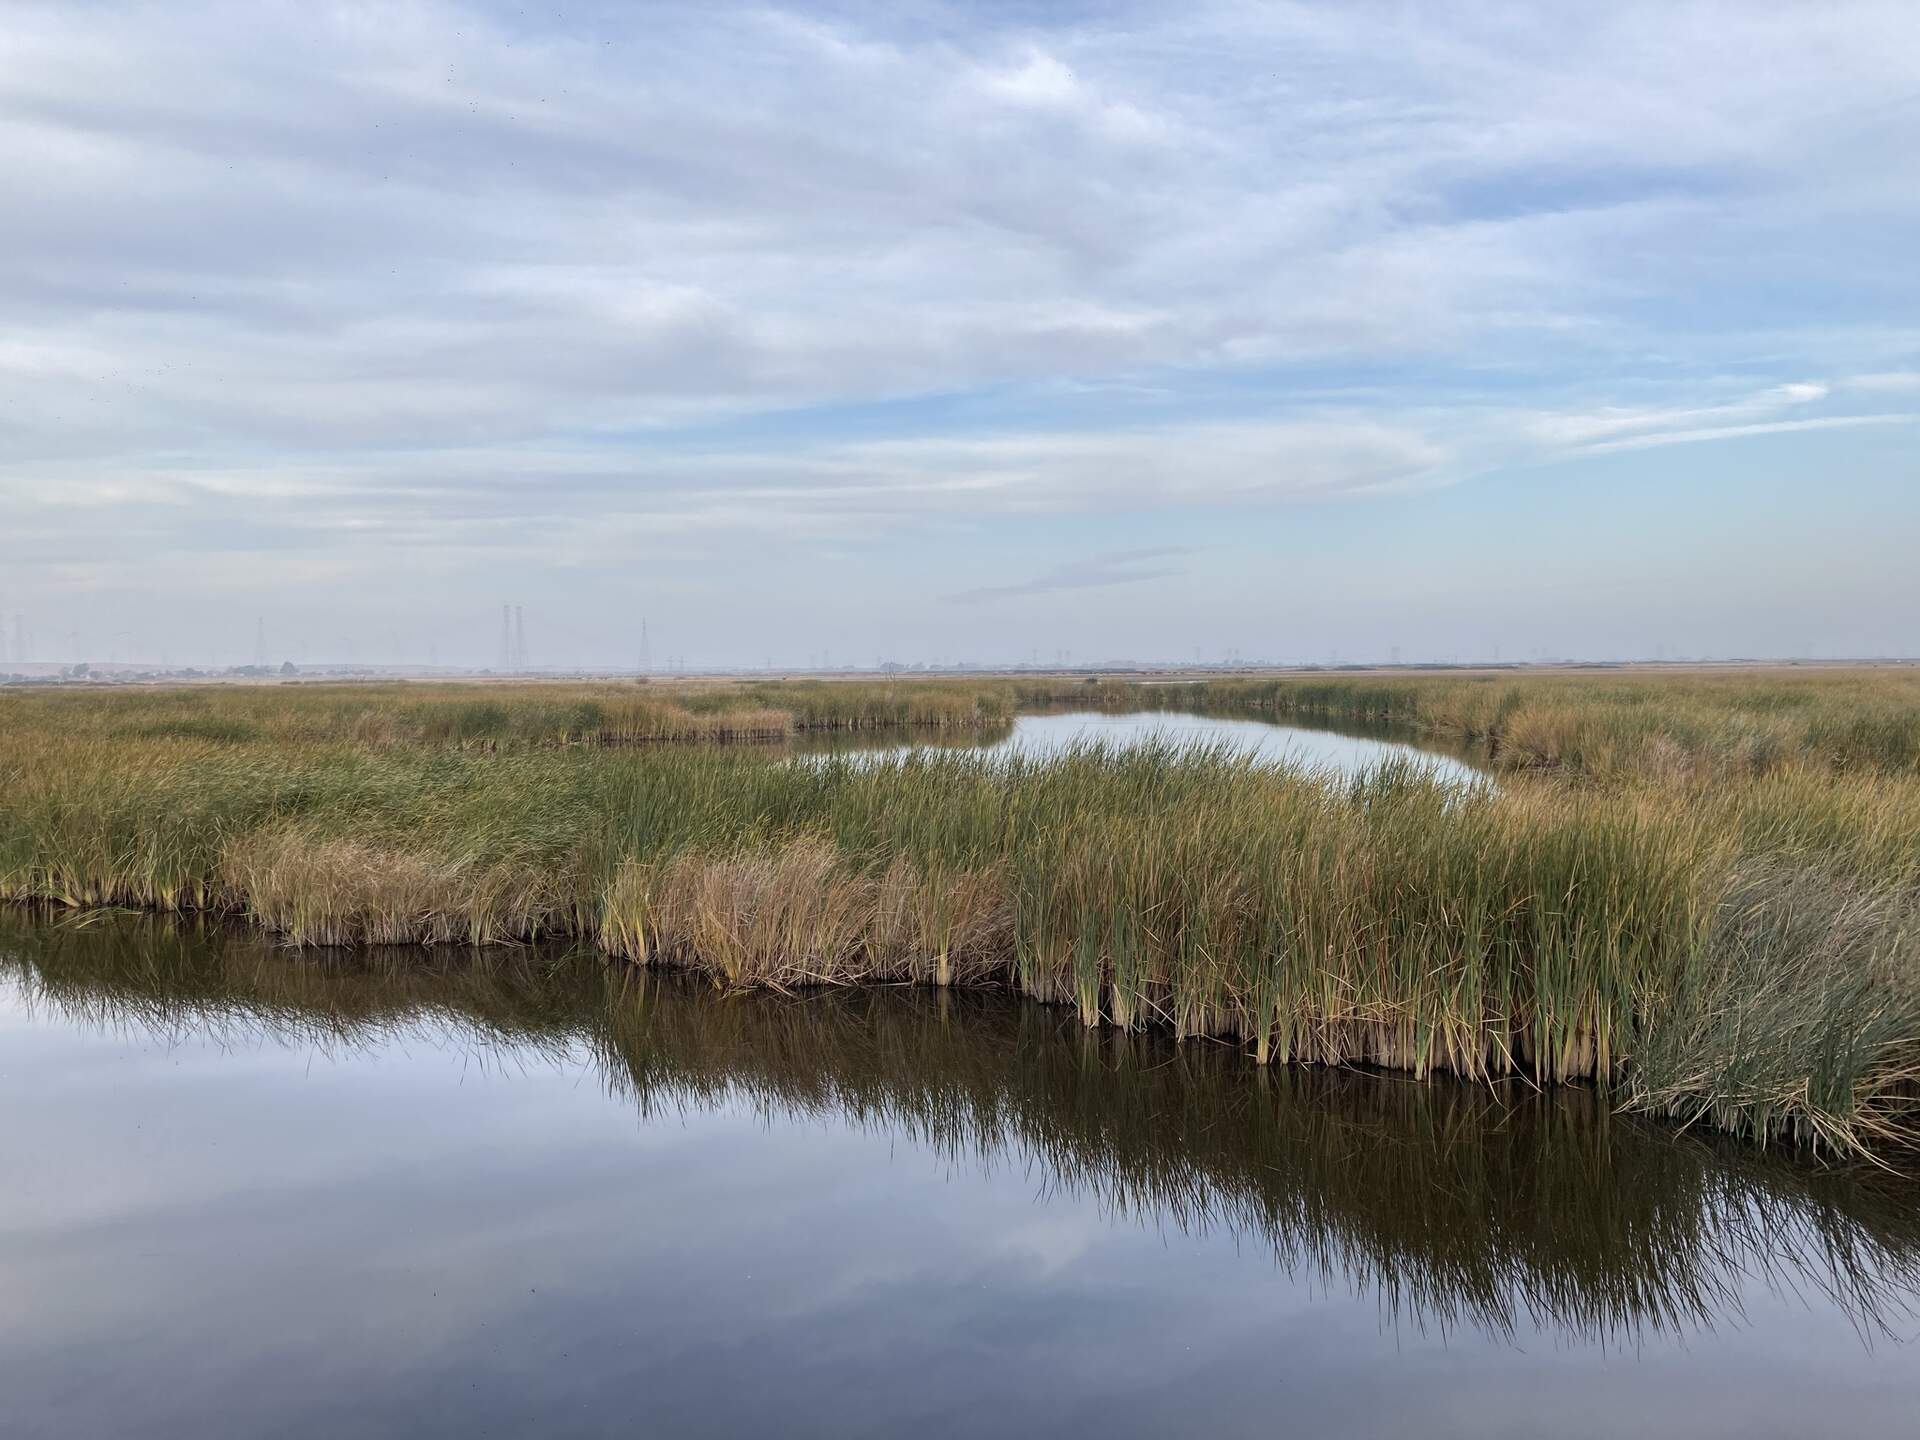
20201203MB_Reflection.jpg ( 2020-12-03 15:42:41 ) Full size: 1920x1440
Calm winter day with clouds reflected in the still water
11 sets found
7 MB_flux graphs found
No data found for MB_met.
28 MB_tule graphs found
Can't check MBWPEESWGT_mixed
1 MB_cam graphs found
Can't check MBEEWPSWEPGT_cam
Can't check SIMBTWEE_met
1 MB_minidot graphs found
Can't check MBSWEEWPBCBA
1 MB_processed graphs found
Can't check MB_fd
1 MB_fd graphs found