Field Notes

<--2020-11-12 11:20:00 | 2020-12-09 14:20:00-->
Other sites visited today: Bouldin Alfalfa | Bouldin Corn | East End | West Pond | Mayberry

Sherman Wetland: 2020-12-03 14:30:00 (DOY 338)
Author: Daphne Szutu
Others: Camilo

Summary: Regular data collection/cleaning, swapped 7500 for calibration, water level almost above staff gauge

2020-12-03
Sherman Wetland

Camilo and I arrived at 14:30 PST. It was a hazy and still day. We’re now into month 9 of coronavirus shelter-in-place. The water level here is still going up. The staff gauge was at 92cm, almost at the top of the staff gauge.

I downloaded met, cam, USB, and miniDOT data. I swapped the miniDOT and water level sensor desiccant. This miniDOT was really hard to open, so hopefully we did not close it as tightly this time. The wash reservoir was 80% full; we refilled it. Camilo cleaned flux and rad sensors.

LI-7500 readings:
CO2 447ppm
H2O 379ppm
T 19.9C
P 102.4kPa
SS 101--> 103 after cleaning
LI7700 readings:
CH4 2.5 ppm
RSSI 20--> 78 after cleaning

We left at 14:50 PST.

2 photos found

Clouds reflected in still waters
20201203SW_HazySunset.jpg ( 2020-12-03 14:57:21 ) Full size: 1920x1440
Clouds reflected in still waters

Daphne and Camilo on site
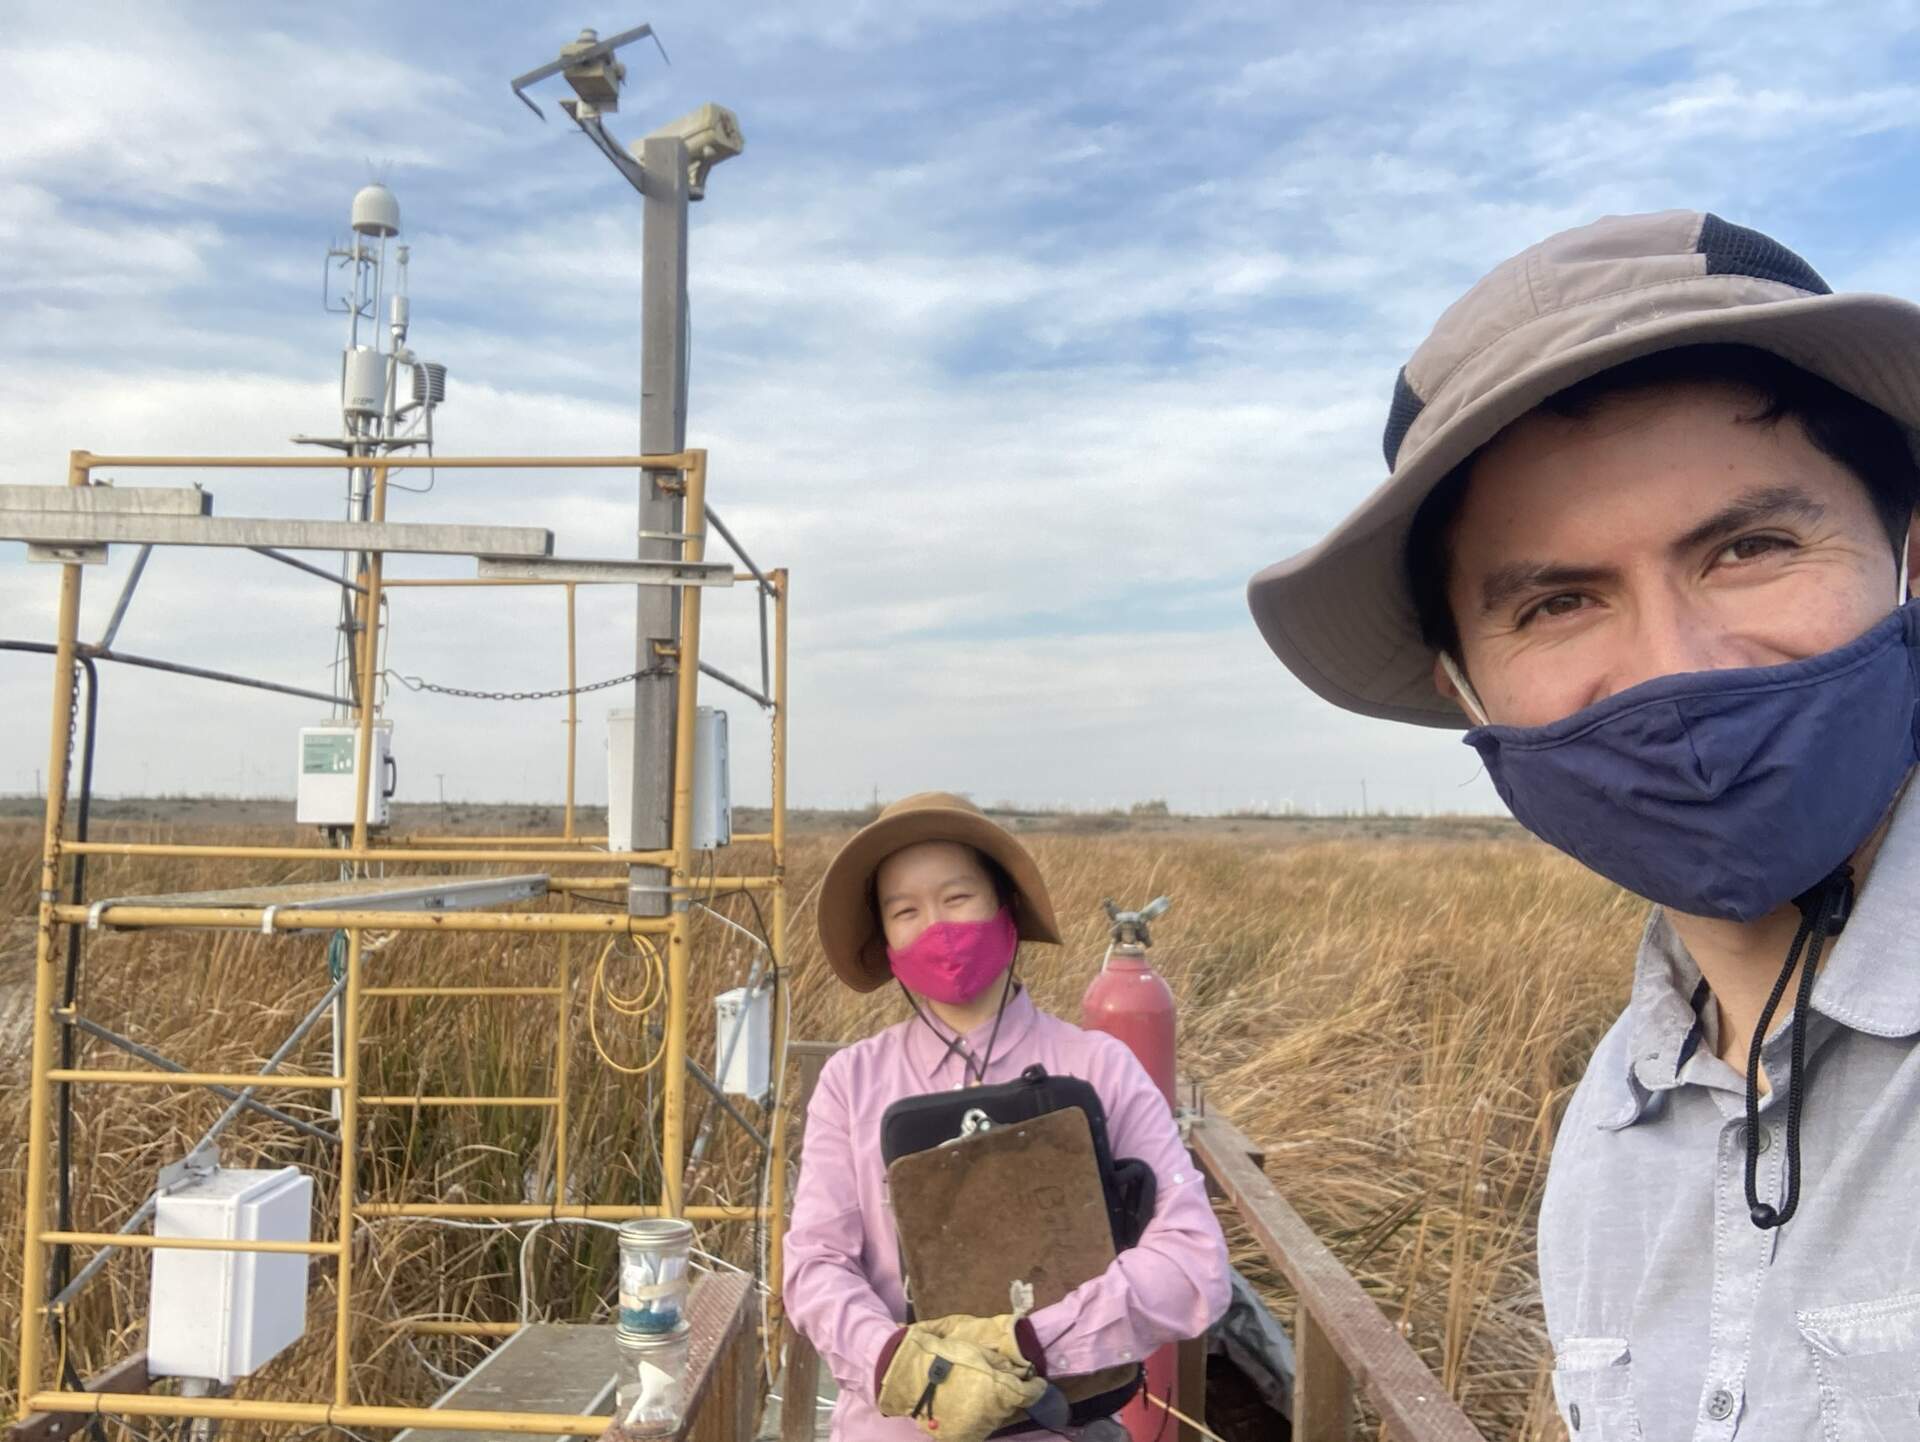
20201203SW_Tower.jpg ( 2020-12-03 14:56:52 ) Full size: 1920x1442
Daphne and Camilo on site

Graphs display:
7 sets found

Can't check MBWPEESWGT_mixed
Can't check MBEEWPSWEPGT_cam
16 SW_met graphs found

Explore the graph:Temperatures in a new window

Explore the graph:Water Temperature Profile A in a new window

Explore the graph:Water Temperature Profile B in a new window

Explore the graph:Soil Temperature Profile C2 in a new window

Explore the graph:Soil Heat Flux in a new window

Explore the graph:Four channel Radiometer in a new window

Explore the graph:Sherman Wetland PAR in a new window

Explore the graph:PRI Channels in a new window

Explore the graph:NDVI Channels in a new window

Explore the graph:Water level and Rain in a new window

Explore the graph:Dissolved CO2 in a new window

Explore the graph:Air Pressure in a new window

Explore the graph:Battery Voltage and RH in a new window

Explore the graph:Soil Temperature Profile C1 in a new window

Explore the graph:SRS NDVI and PRI in a new window

Explore the graph:SW miniDOT Dissolved Oxygen in a new window

4 SW_flux graphs found

Explore the graph:CO2 and H2O in a new window

Explore the graph:Wind in a new window

Explore the graph:Methane in a new window

Explore the graph:Data Counts in a new window

Can't check MBSWEEWPBCBA
Can't check SW_Temp
14 SW_Temp graphs found

Explore the graph:Temperatures in a new window

Explore the graph:CO2 and H2O in a new window

Explore the graph:Wind in a new window

Explore the graph:Methane in a new window

Explore the graph:Data Counts in a new window

Explore the graph:Temperature Profile A in a new window

Explore the graph:Temperature Profile B in a new window

Explore the graph:Temperature Profile C in a new window

Explore the graph:Soil Heat Flux in a new window

Explore the graph:Four-channel radiometer in a new window

Explore the graph:NDVI Channels in a new window

Explore the graph:PAR in a new window

Explore the graph:Air Pressure and Water Level in a new window

Explore the graph:Air T and RH in a new window

3 SW_arable graphs found

Explore the graph:Incoming Solar Bands in a new window

Explore the graph:Reflected Solar Bands in a new window

Explore the graph:Solar Radiation in a new window