Field Notes
<--2020-11-19 08:40:00 | 2020-12-09 08:45:00-->Other sites visited today: Bouldin Alfalfa | East End | West Pond | Mayberry | Sherman Wetland
Phenocam link: Searching...
Bouldin Corn: 2020-12-03 08:40:00 (DOY 338)
Author: Daphne Szutu
Others: Camilo
Summary: Regular data collection/cleaning, swapped 7500 for calibration, flooding imminent, 7700 spray not working--fixed, tested precip bucket--more testing needed
| 2020-12-03 Bouldin Corn Camilo and I arrived at 8:40 PST. It was a calm and hazy day with many snow geese flying overhead. We’re now into month 9 of coronavirus shelter-in-place. Since it had looked rather hazy driving in through Antioch, I checked the PurpleAir live reading. The PurpleAir PM2.5 AQI was 135. The Rio Vista AirNow station had an AQI of 80. The fields to our west are flooded. Our site is still dry but the water level has been rising for the last week. Tyler has his chambers up on blue crates. I downloaded met, cam, USB, PA, and FD data. I cleared the FD chamber after download. I swapped the desiccant for the water level sensor. Camilo cleaned flux and rad sensors and topped off the reservoir. There are 2 days of PA data missing from 2 weeks ago, but the data since then seem fine. I started downloading the Eosense NFD data, but it was taking about 15 minutes to download each chamber. I downloaded data from only 2 of the 4 chambers. Joe and I plan to come back next week, so I can download the rest of the data then. Part of the reason why it takes so long to download is that the chambers are collecting 5-second data. We swapped the LI-7500 for calibration: sn 0073 came down and sn 75H-2176 went up. I uploaded a new config file, updated the pressure coefficients, and reset the box. I tested the 7700 spray. The pump did not seem to have enough power. Camilo disconnected the re-connected the power cable at the box, which seems to have fixed the problem. Looking at the data, the 7700 has been washing as expected the last 2 weeks, so this problem might have just started. We tested the precip bucket sn 65548-615 again with 473ml of water. We poured in only half of the water at a time so that there is less pressure head change from start to finish, slowing the drip rate. We got 117 tips; last time we got 116 tips. We did not adjust the bucket. I think our method is producing a consistent number, but we should try other ways of dispensing 473ml of water in 45 minutes. This should result in 100 +/- 3 tips per the manual. Joe suggested trying out the peristaltic pump. LI-7500 readings (sn 0073 --> sn 0073 after cleaning --> sn 75H-2176): CO2 480ppm --> 480 --> 493 H2O 360ppm --> 350 --> 344 T 6.8C --> 7.1 --> 7.6 P 101.9kPa --> 101.9 --> 102.1 SS 97--> 99 --> 102 LI7700 readings: CH4 2.6ppm RSSI 37-->89 after cleaning We left at 9:50 PST. |
3 photos found

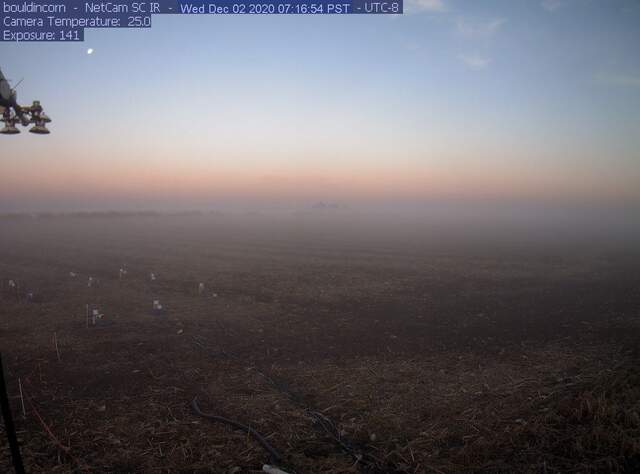
bouldincorn_2020_12_02_071654.jpg ( 2020-12-02 07:16:54 ) Full size: 1296x960
Fog and moonrise at dawn

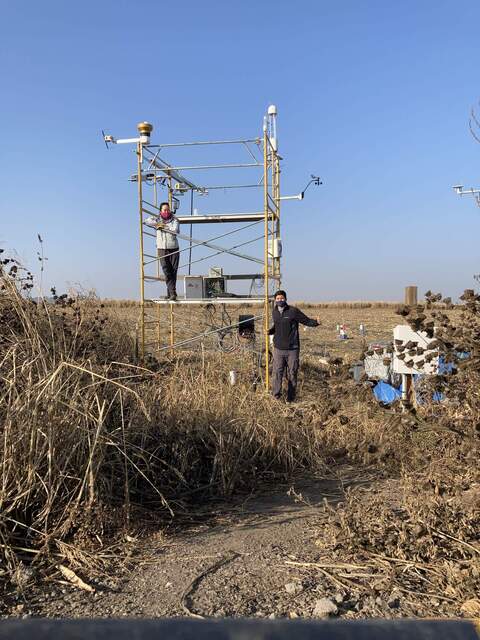
20201203BC_Tower.jpg ( 2020-12-03 09:40:41 ) Full size: 1440x1920
Daphne and Camilo on site

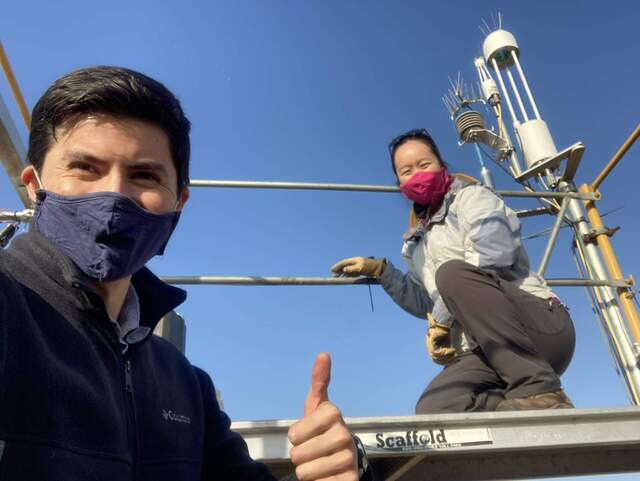
20201203BC_MaskSelfie.jpg ( 2020-12-03 09:17:48 ) Full size: 1920x1442
Camilo and Daphne on site. Staying outdoors + masks + social distancing = thumbs up!
6 sets found
17 BC_met graphs found
5 BC_flux graphs found
Can't check TATWBABCSB_cam
Can't check MBSWEEWPBCBA
2 BC_pa graphs found
1 BC_arable graphs found

