
Field Notes
<--2020-08-11 10:30:00 | 2020-09-09 09:00:00-->Other sites visited today: Bouldin Alfalfa | East End | Sherman Wetland
Phenocam link: Searching...
Mayberry: 2020-08-28 12:30:00 (DOY 241)
Author: Daphne Szutu
Others:
Summary: Regular data collection/cleaning, water level high, water samples for Isabel, swapped LI-7500 for calibration, removed flurometer for cleaning, cleaned conductivity sensor, added eosFD with long collar to boom, shortened floating boom guy wire
| 2020-08-28 Mayberry I arrived at 12:30 PDT. It was a breezy and smoky day, and the wetland is starting to brown. The poor air quality in the last week or so has been from wildfire smoke. The water level is much higher than last visit; the staff gauge read 84.5 cm. I collected water samples for Isabel at 12:00 PST. There were some red, round buoys southeast of the tower that I don’t remember being there before. Update: Joe said they are from Gavin's bubble traps. I downloaded met, cam, miniDOT, and USB GHG data. I swapped the miniDOT desiccant. I checked the eddy clock: when it was 11:45, I set it to 11:48. I swapped the LI-7500A for calibration: sn 0035 came off and sn 75H-2669 went on. I updated the configuration file, changed the pressure coefficient, and reset the box. I cleaned flux and rad sensors and pulled the conductivity sensor out of the mud to clean its orifice (which had some mud in it). I shortened the conductivity cable so the sensor could be above the muck. The wash reservoir was 80% full; I refilled it and left the lid open to discourage wasps. I removed the fluorometer sn 2300565 to bring back to the lab for a thorough cleaning and brush swap. I added the eosFD sn FD20190027 back onto the floating boom. It has a longer black collar to accommodate the changing water levels. However, the chamber membranes were still below the water level when I lowered the boom. I ended up shortening the floating boom guy wire (coated-wire cable) by tying a knot in it at the end. Right now the FD membranes are about 5-10cm above the water level. The FD chamber does not seem quite level, and I’m not sure if that changes the surface area the chamber is measuring. Maybe it doesn’t matter underwater. LI-7500 readings (sn 0035--> sn 0035 after cleaning --> sn 75H-2669): CO2 403ppm --> 410 --> 407 H2O 806ppm --> 767 --> 778 T 24.2C --> 24.3 --> 24.1 P 100.6kPa --> 100.6 --> 100.7 SS 96--> 99 --> 101 LI7700 readings: CH4 2.0ppm RSSI 53-->71 after cleaning I left at 13:40 PDT. |
3 photos found
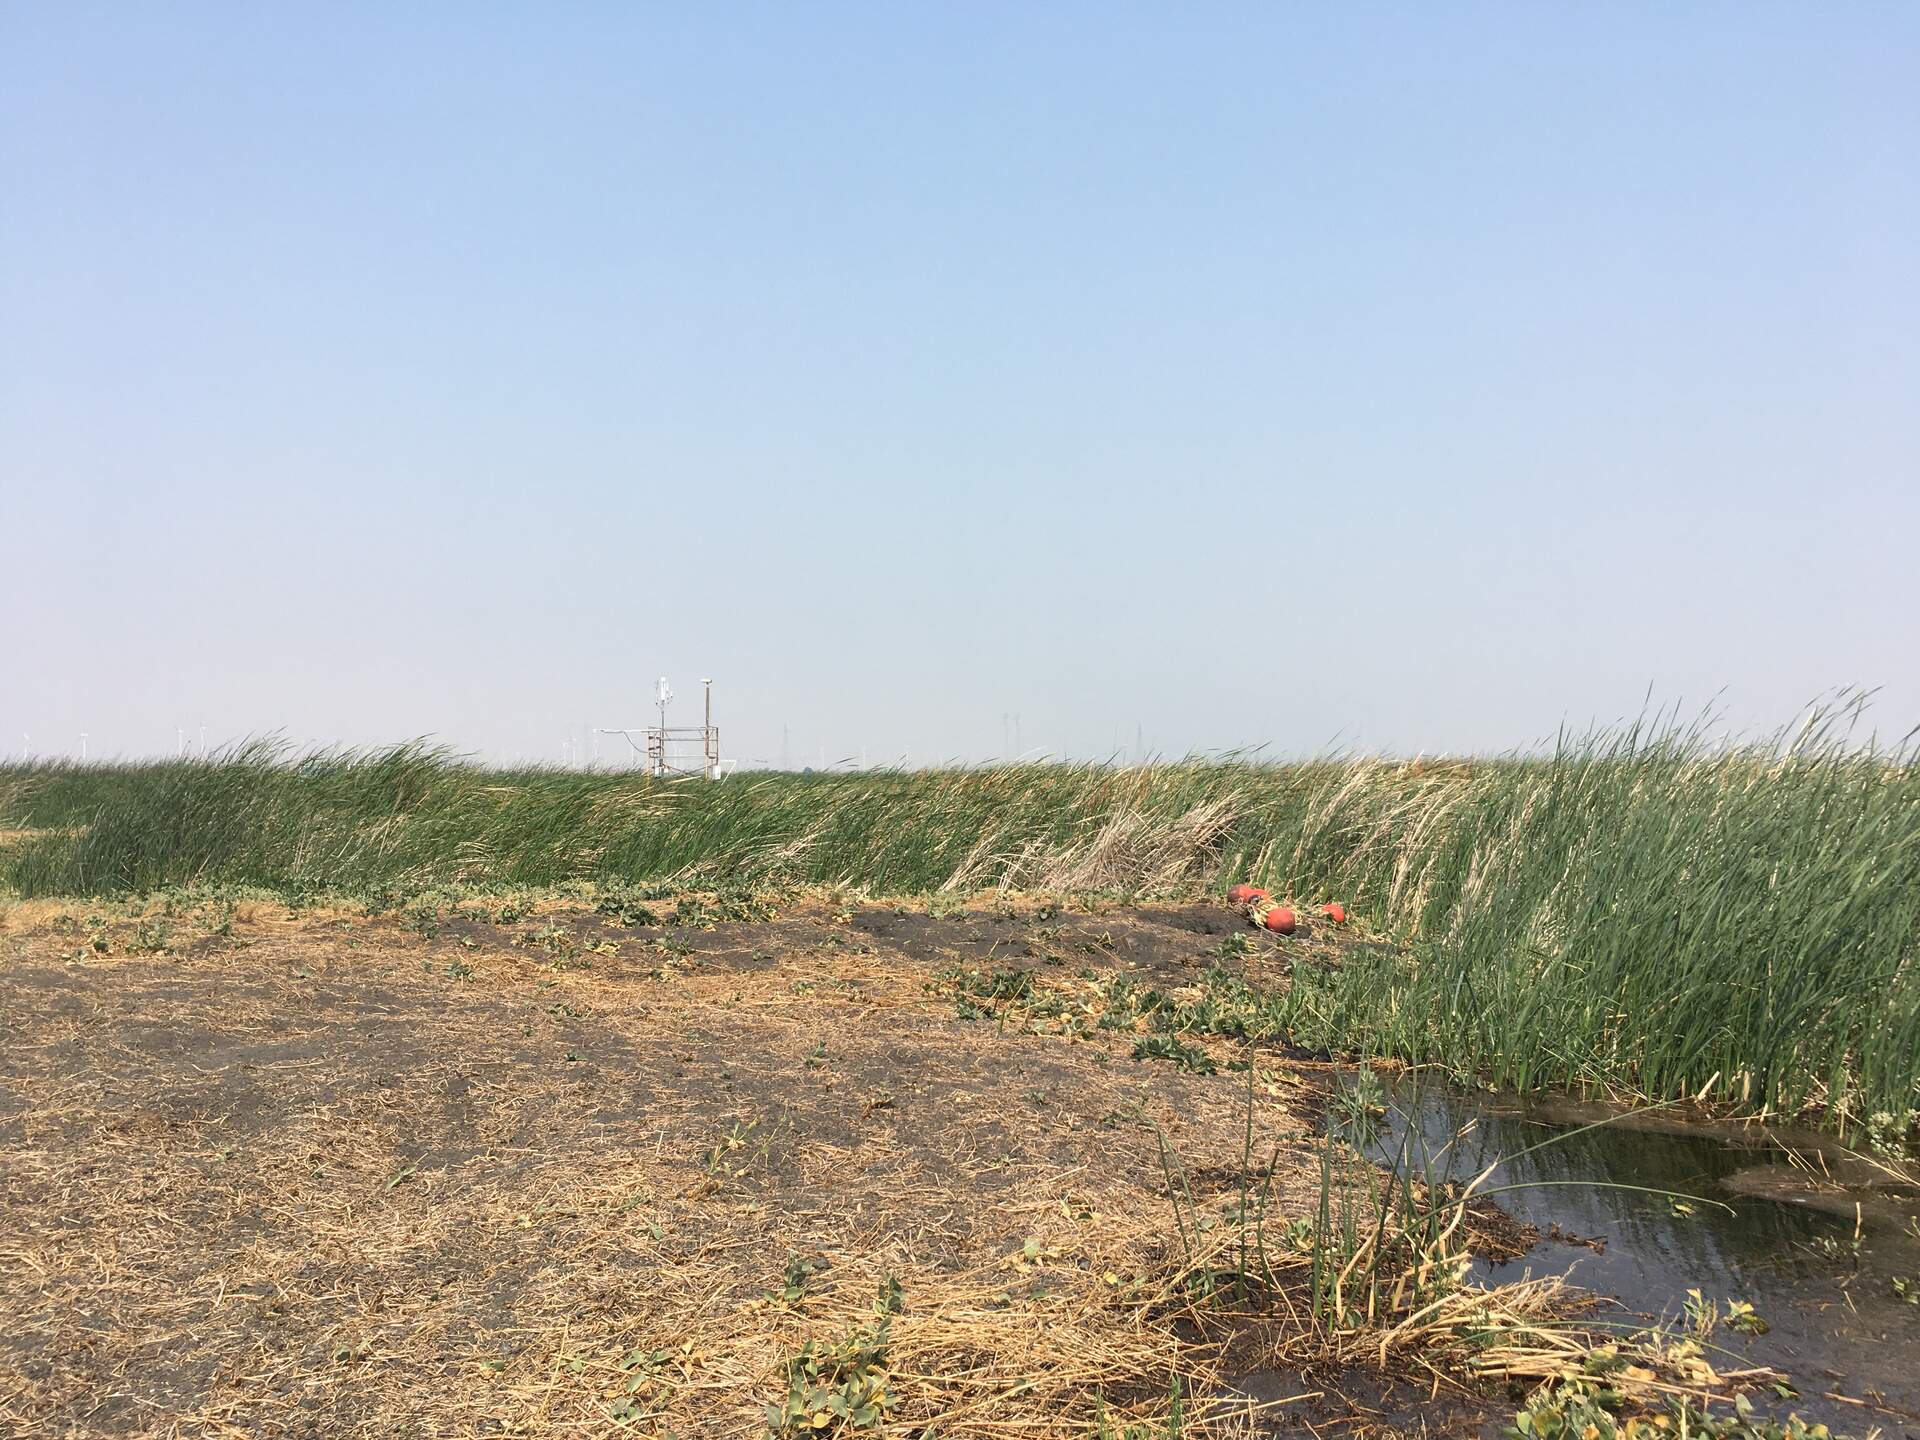
20200828MB_RedBuoys.jpg ( 2020-08-28 13:52:08 ) Full size: 1920x1440
Round, red buoys southeast of the tower. They are from Gavin's bubble traps.
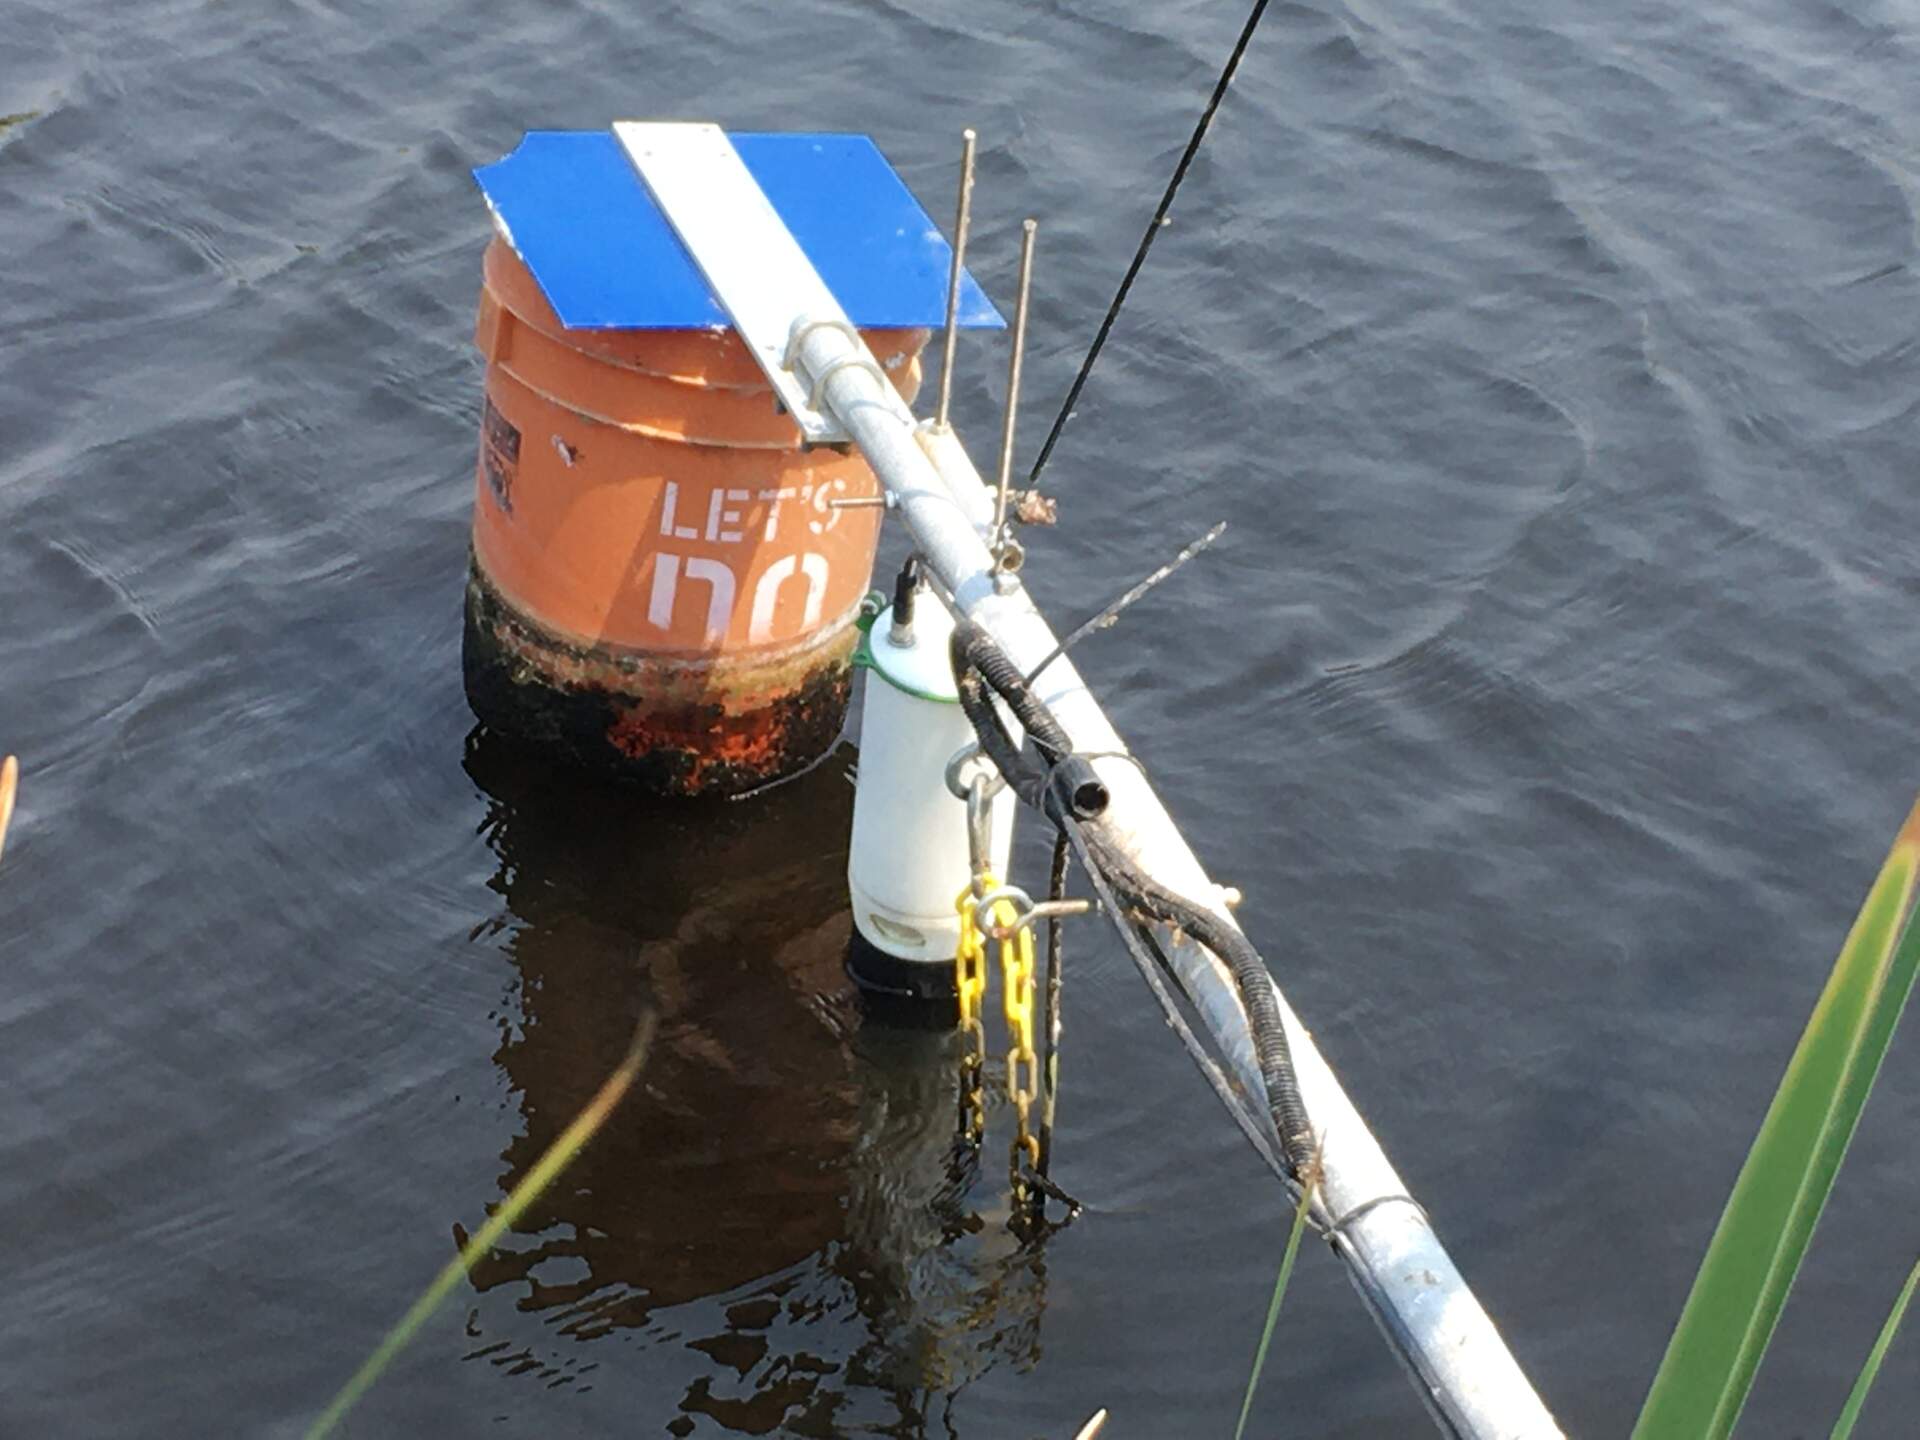
20200828MB_FDLongCollar.jpg ( 2020-08-28 13:38:05 ) Full size: 1920x1440
eosFD chamber with long collar on floating boom. The boom level is artificially raised right now so that the water level is below the chamber membranes.
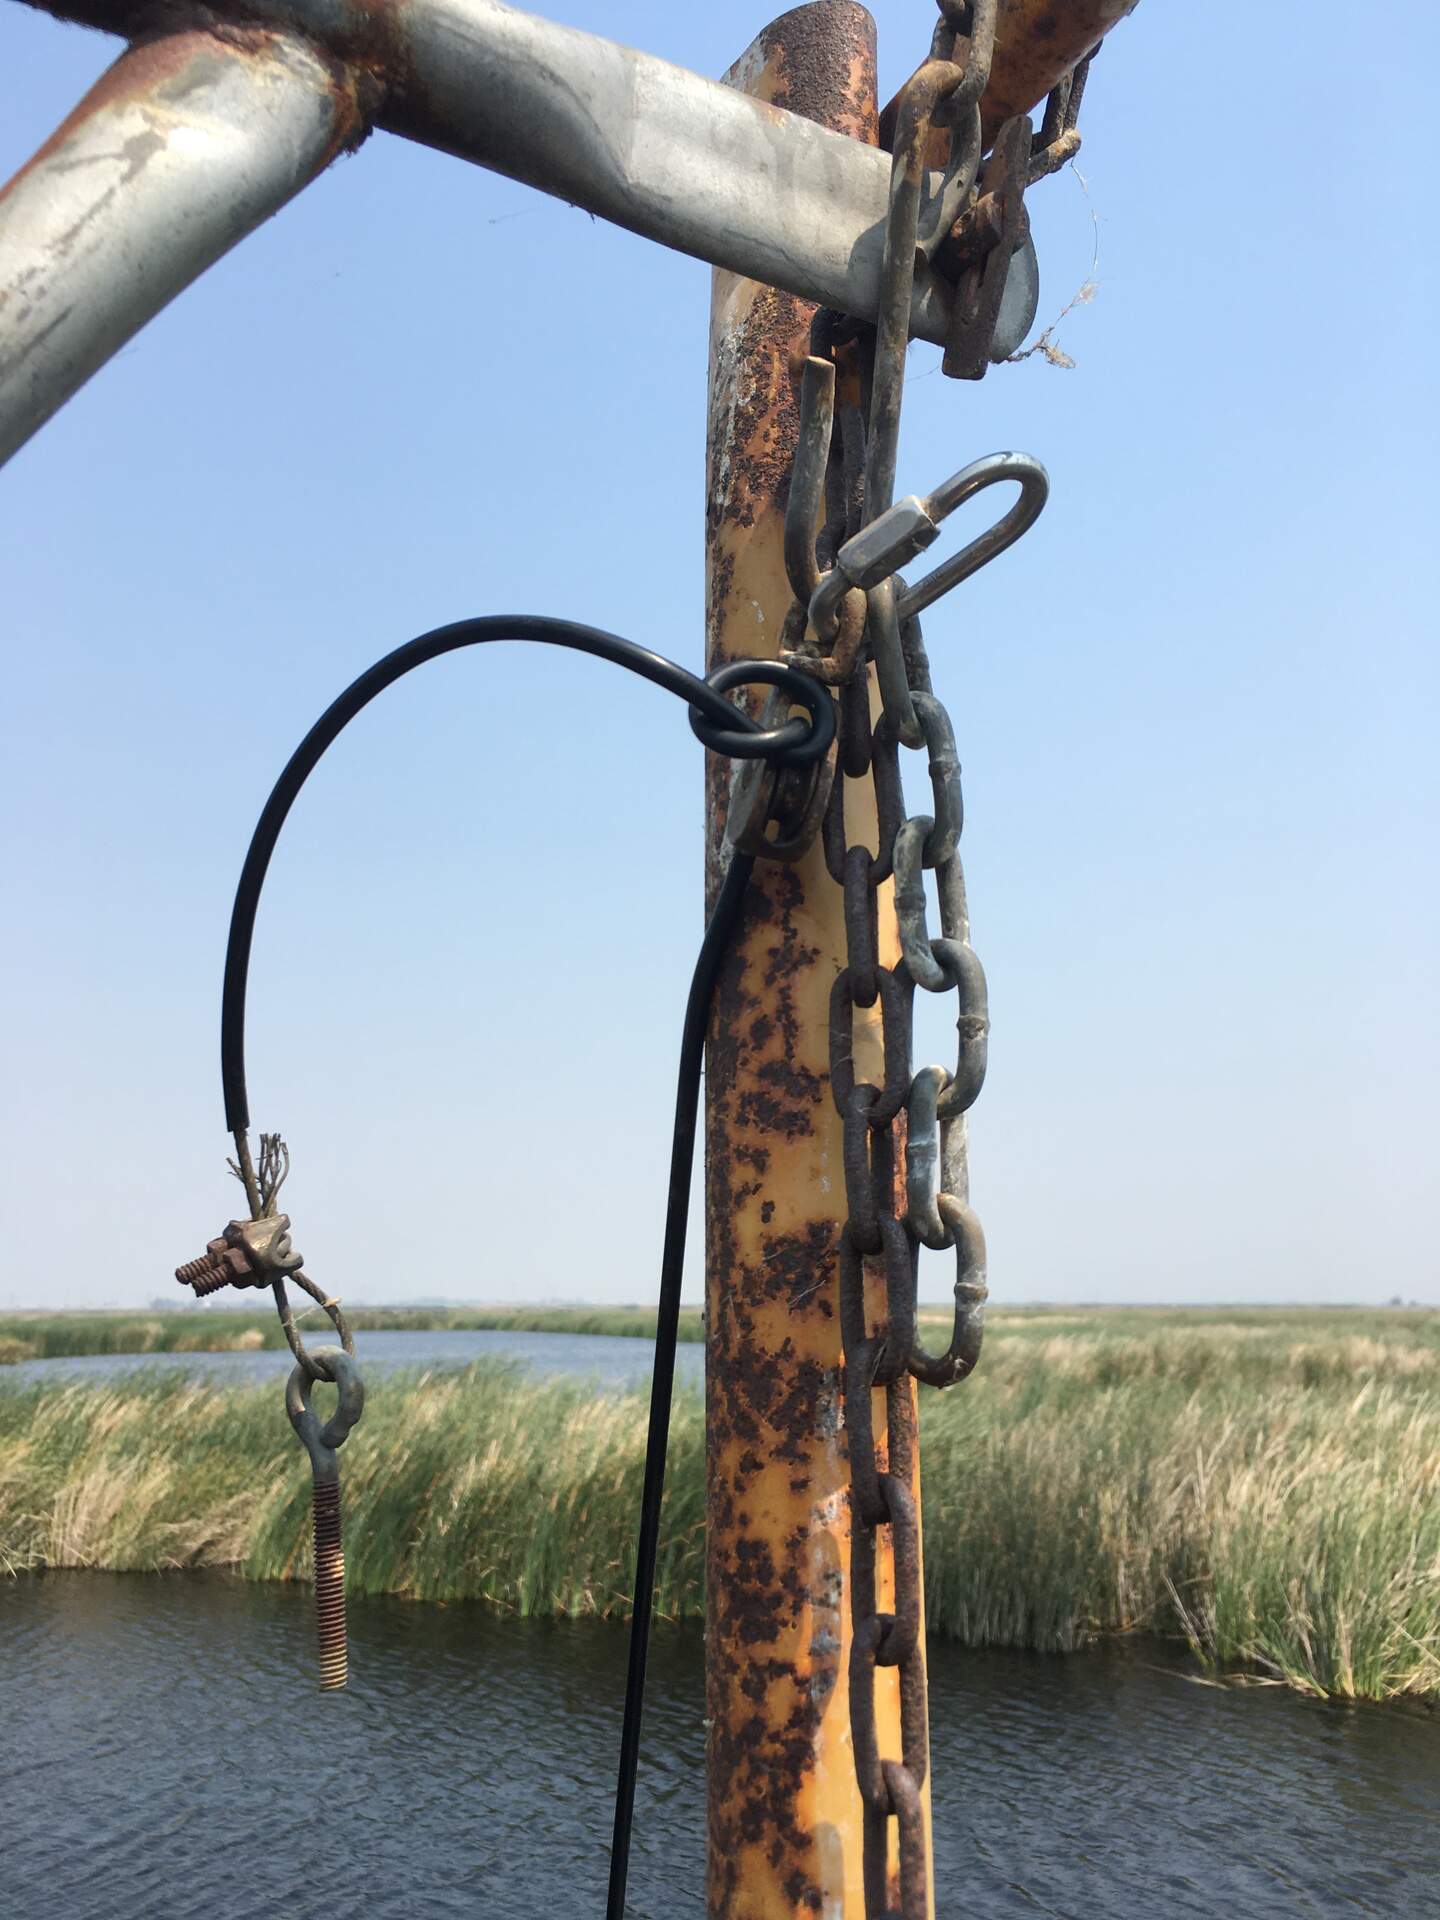
20200828MB_CableKnot.jpg ( 2020-08-28 13:37:18 ) Full size: 1440x1920
I tied a knot in the floating boom guywire cable to pull the boom up higher
11 sets found
7 MB_flux graphs found
No data found for MB_met.
28 MB_tule graphs found
Can't check MBWPEESWGT_mixed
1 MB_cam graphs found
Can't check MBEEWPSWEPGT_cam
Can't check SIMBTWEE_met
1 MB_minidot graphs found
Can't check MBSWEEWPBCBA
1 MB_processed graphs found
Can't check MB_fd
1 MB_fd graphs found