Field Notes
<--2020-08-28 12:30:00 | 2020-09-10 10:35:00-->Other sites visited today: West Pond
Phenocam link: Searching...
Mayberry: 2020-09-09 09:00:00 (DOY 253)
Author: Ariane Arias-Ortiz
Others: Erin
Summary: monthly water and porewater sampling, very high water level, the wetland is green
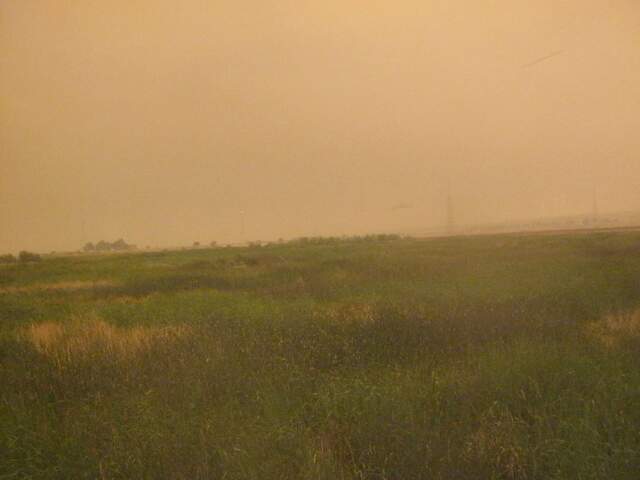
| Erin and I arrived at 9:00 am at Mayberry. The sky was apocalyptic, dark-red-ish due to the combination of the marine layer and the smoke from the wildfires aloft above it. We could barely see the sun, temperatures were cool and it was windy. The wetland was much greener compared to last month, a lot of new vegetation has grown since. I think the plants are liking the high water level which was at 86 cm. We started sampling surface waters at the channel sites, inlet, and outlet because we were unsure about entering the wetland with the peristaltic pump and battery in such high water conditions. We first tried to find the sites inside the wetland without equipment. There has been a lot of newly grown cattails. We could find all sites and went ahead sampling surface and porewaters inside the wetland. We used the big grey bucket as a boat for the pump and the battery, we could push it while we were advancing to the sites, which is much nicer than having to carry it. Sampling was messier than normally, it was hard to keep things dry. We found field notes floating in the water a couple of times, great we had waterproof paper! The mosquitoes gave us a hard time as well, they were particularly bad this time. Surface water conductivity was similar across the channel and wetland sites and was similar to inlet conductivity, which is usually the lowest. pH values were lower than last month's with lower pH at the wetland vegetated sites than at the channel sites. Readings at the tower (channel) were: Conductivity: 1727 uS Salinity: 0.99 ppt pH: 7.21 Temp: 19.1 C We sampled porewaters at the regular sites and depths, however we had problems at vegetated sites were the hydraulic conductivity seemed to have been reduced even more. We were unable to pull porewaters below -20 cm. This was not the case at the channel sites were we could collect samples as usually (-10, -30, -50 cm). Readings porewaters (10-20 cm) Conductivity: 5391 uS Salinity: 3.25 ppt pH: 6.75 Temp: 19.9 C We processed the samples in the field near the Antioch bridge and left at around 5 pm. |
2 photos found

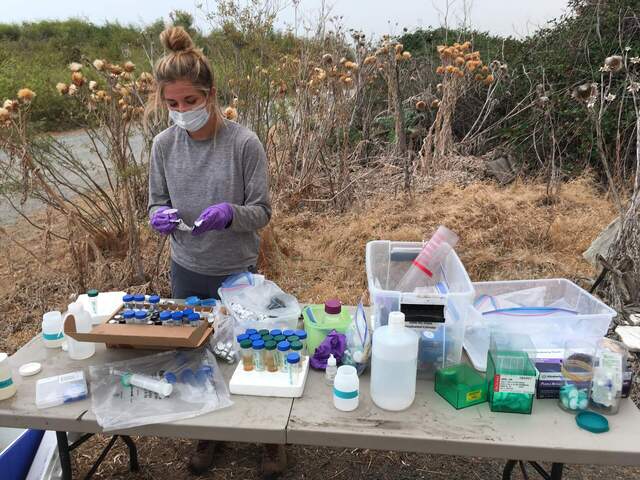
20200909MB_OutdoorLab.jpg ( 2020-09-09 00:00:00 ) Full size: 1920x1440
Erin processing water samples (filter, filter and filter again)

MB_autocam_20200909_0745.jpg ( 2020-09-09 07:45:02 ) Full size: 1920x1440
Orange skies from wildfire smoke
11 sets found
7 MB_flux graphs found
No data found for MB_met.
28 MB_tule graphs found
Can't check MBWPEESWGT_mixed
1 MB_cam graphs found
Can't check MBEEWPSWEPGT_cam
Can't check SIMBTWEE_met
1 MB_minidot graphs found
Can't check MBSWEEWPBCBA
1 MB_processed graphs found
Can't check MB_fd
1 MB_fd graphs found

