Field Notes

<--2020-08-26 14:00:00 | 2020-09-01 13:55:00-->
Other sites visited today: East End | Mayberry | Sherman Wetland

Bouldin Alfalfa: 2020-08-28 09:20:00 (DOY 241)
Author: Camilo Rey-Sanchez
Others:

Summary: A Ci curves by Tyler's chambers. Plane spraying the fields

I arrived to Bouldin Alfalfa at 9:20 AM. It was a clear day with sporadic cloud cover and okay air quality. When I arrived, I observed from the levee that there was a plane spraying pesticides/herbicides? on our field and the adjacent ones. I waited and approached the alfalfa once the plane was gone. I did not want to get to close to the area near the tower because it had been recently sprayed, so I stayed near the entrance and was planning to do photosynthesis there. However, the plane came again, giving me clear signals to go away. I left the area and decided to do measurements in the alfalfa by Tyler's chambers. The plane continued spraying for about an hour after that. The alfalfa in our field looked nice and healthy about 60 cm tall, similar to the alfalfa by Tyler's chambers. I performed four A Ci response curves from 10 Am to 1 PM using the usual CO2 concentration steps: 400,300,200,150,100,75,50,400,500,600,800,1000,1300 ppm. I also ran a light response curve on the last leaf. I measured chlorophyll content and collected the leaves and brought them to the lab. I left at around 1:30 PM

Next Mowing: 2020-09-05

2 photos found

A-Ci curves in the Alfalfa by Tylers chambers
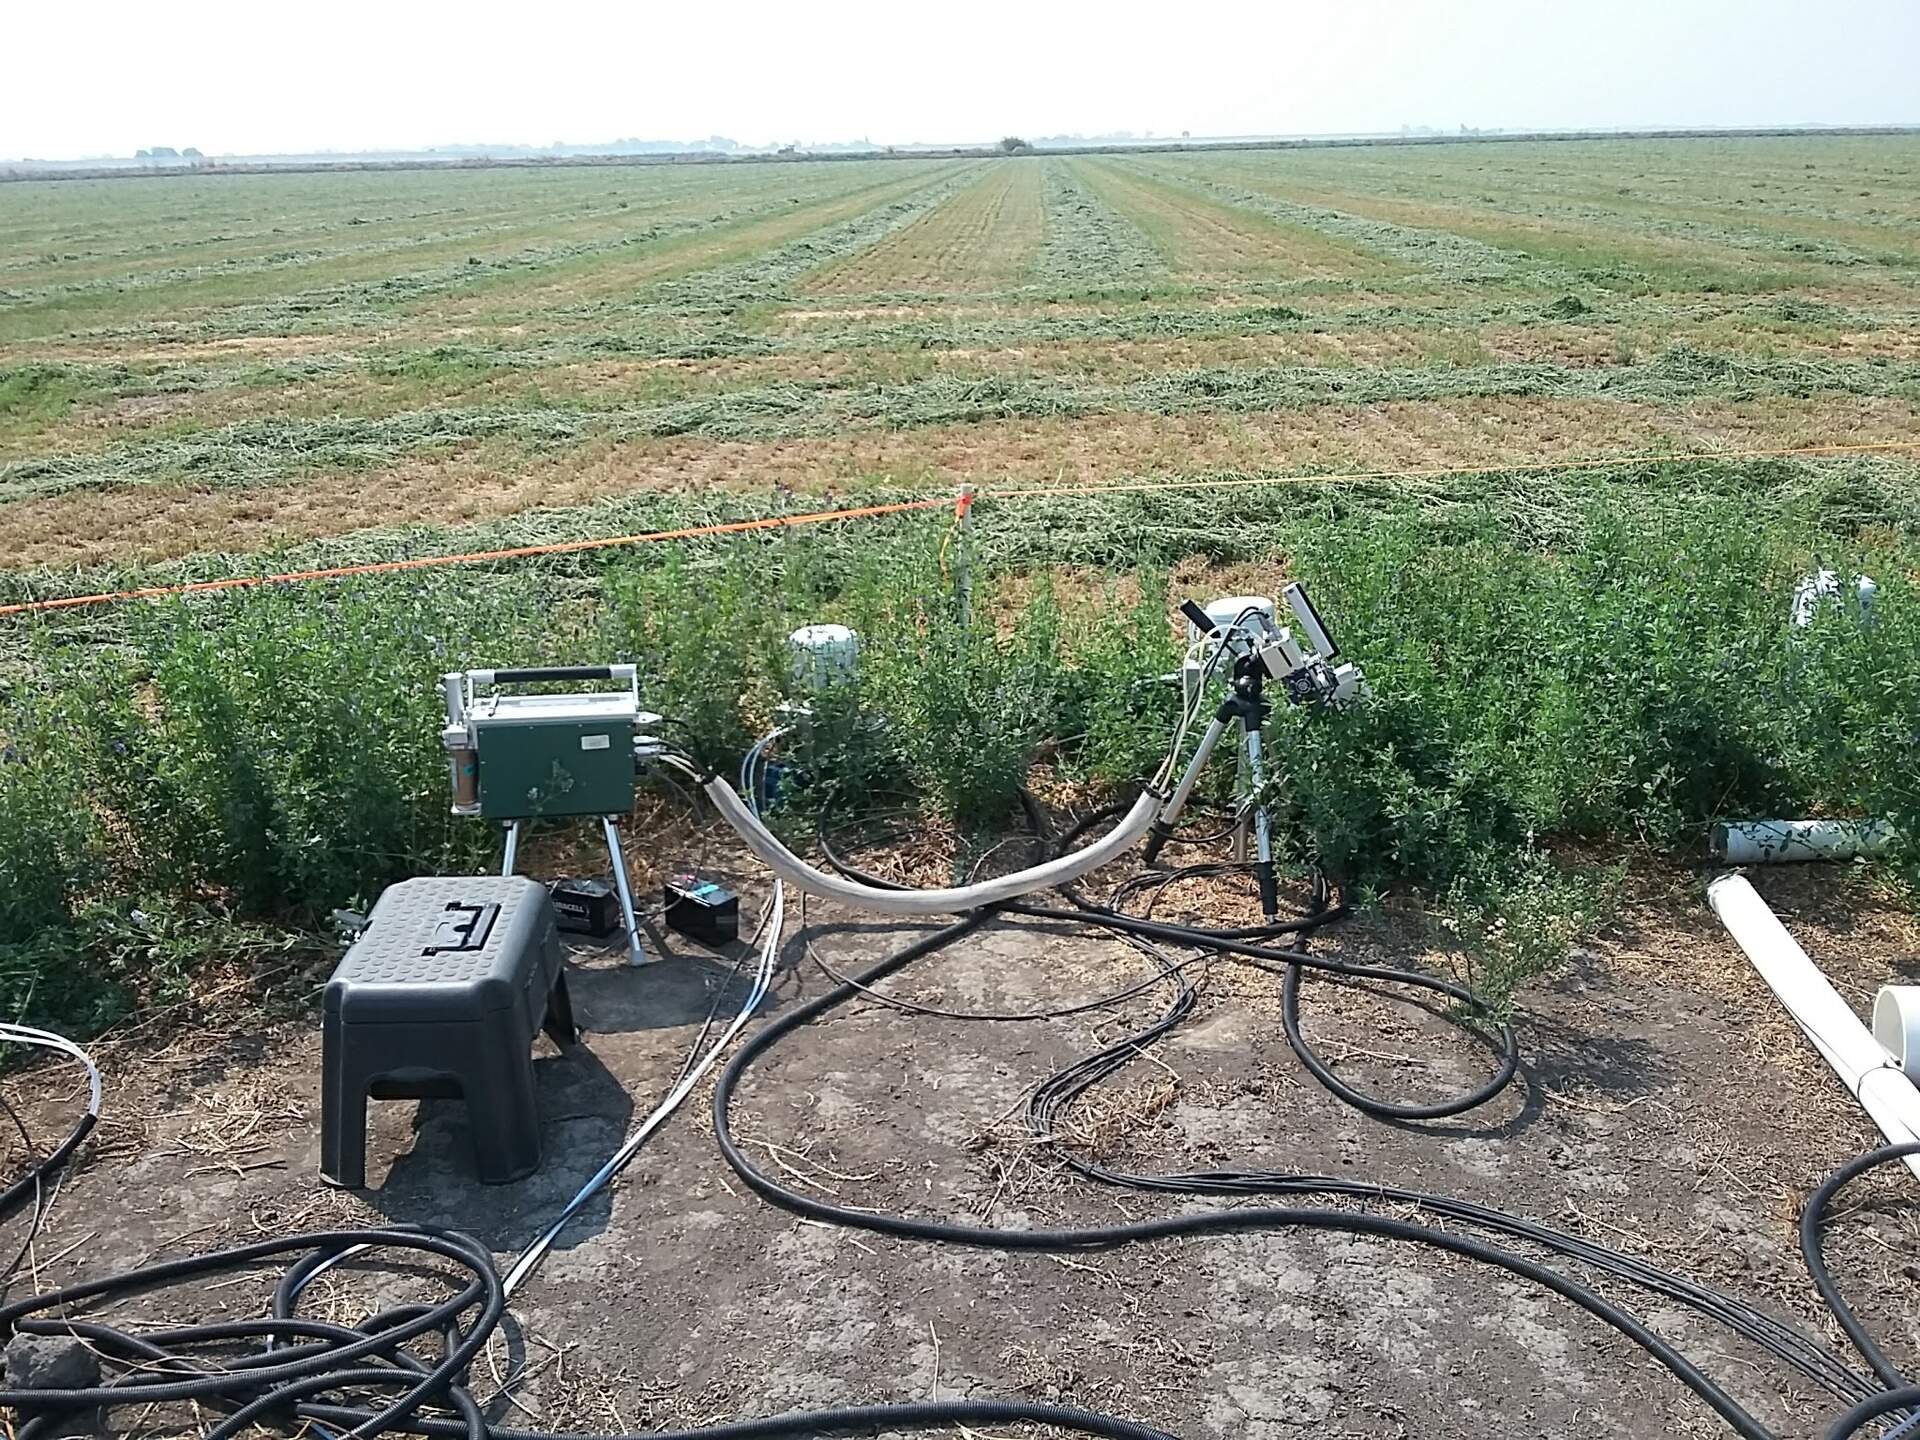
20200828BA_ACicurves_Tyler_Chambers.jpg ( 2020-08-28 11:14:00 ) Full size: 1920x1440
A-Ci curves in the Alfalfa by Tylers chambers

Plane spraying fields with pesticides/herbicides?
20200828_094912.jpg ( 2020-08-28 09:49:00 ) Full size: 1920x1440
Plane spraying fields with pesticides/herbicides?

Graphs display:
7 sets found

5 BA_flux graphs found

Explore the graph:Wind in a new window

Explore the graph:LI-7500 CO2 and H2O in a new window

Explore the graph:7700 CH4 and RSSI in a new window

Explore the graph:Counts in a new window

Explore the graph:CO2 in ppm in a new window

21 BA_met graphs found

Explore the graph:Soil Temperatures Set A in a new window

Explore the graph:Soil Temperatures Set B in a new window

Explore the graph:Soil Temperatures Set C in a new window

Explore the graph:Soil Heat Flux in a new window

Explore the graph:Temperature in a new window

Explore the graph:Solar Radiation in a new window

Explore the graph:Air Pressure and RH in a new window

Explore the graph:Soil Moisture in a new window

Explore the graph:PAR in a new window

Explore the graph:PRI Channels in a new window

Explore the graph:NDVI channels in a new window

Explore the graph:Battery Voltage in a new window

Explore the graph:NDVI and PRI in a new window

Explore the graph:Apogee NDVI in a new window

Explore the graph:FD Chamber A CO2 and Temp in a new window

Explore the graph:FD Chamber B CO2 and Temperature in a new window

Explore the graph:Surface Temperature in a new window

Explore the graph:Sentek Soil Moisture profile in a new window

Explore the graph:Sentek Soil Temperature profile in a new window

Explore the graph:Sentek Soil Salinity profile in a new window

Explore the graph:Forced Diffusion Soil CO2 Flux in a new window

6 BA_arable graphs found

Explore the graph:Incoming Solar Bands in a new window

Explore the graph:Reflected Solar Bands in a new window

Explore the graph:Solar Radiation in a new window

Explore the graph:Temperatures, PPT in a new window

Explore the graph:Sentek Deep Soil Moisture in a new window

Explore the graph:Pressure, RH in a new window

Can't check TATWBABCSB_cam
Can't check MBSWEEWPBCBA
2 BA_processed graphs found

Explore the graph:Energy in a new window

Explore the graph:Evapotranspiration in a new window

No data found for BA_adex.