
Field Notes
<--2020-08-11 08:50:00 | 2020-09-10 08:45:00-->Other sites visited today: Bouldin Alfalfa | East End | Mayberry
Phenocam link: Searching...
Sherman Wetland: 2020-08-28 09:50:00 (DOY 241)
Author: Daphne Szutu
Others:
Summary: Permanent: Regular data collection/cleaning, water level still low, swapped LI-7500 for calibration, installed water level sensor
Temp: Regular data collection/cleaning, swapped LI-7500 for calibration, missing midday data for 10 days--not sure why
| 2020-08-28 Sherman Wetland I arrived at 9:50 PDT. It was a windy and smoky day; I could barely see Mt. Diablo. The poor air quality in the last week or so has been from wildfire smoke. The water level is even lower than before. The staff gauge read -1 cm. All the water sensors (eosGP, miniDOT, conductivity) are in the air, and I can see the mud below the eosGP and miniDOT sensors. I gave the staff gauge a good scrub and used a tap measure to measure the height of the water below the bottom of the staff gauge. I downloaded met, cam, miniDOT, and USB GHG data. There was a 7700 clock sync error when I arrived, which persisted after I reset the box. I slightly adjusted the eddy clock: when it was 9:23, I set it to 9:24. I reset the box again, which solved the clock sync error. I also synced the phenocam clock: when it was 9:05, I set it to 9:07. I cleaned flux and rad sensors and the conductivity sensor. There was a little fluff inside the orifice but nothing too notable. The wash reservoir was 90% full; I refilled it. I installed water level sensor sn 20010026. It was dry inside the water level well. It was hard for to feel confident about the sensor depth measurements. The top of pipe to sensor was 90cm, the top of pipe to ground was 45 cm, so the sensor z position was -0.45m. I swapped the LI-7500A for calibration: sn 0035 came off and sn 75H-2669 went on. I updated the configuration file, changed the pressure coefficient, and reset the box. LI-7500 readings (sn 75H-2182 --> sn 75H-2182 after cleaning --> sn 75H-2667): CO2 400ppm --> 414 --> 415 H2O 696ppm --> 726 --> 706 T 20.0C --> 20.3 --> 20.0 P 100.9kPa --> 100.9 --> 101.0 SS 90--> 98 --> 102 LI7700 readings: CH4 1.93ppm RSSI 45-->79 after cleaning I left at 11:10 PDT. 2020-08-28 Sherman Wetland Temporary Tower I arrived at 11:25 PDT. It was a breezy and smoky day. The poor air quality in the last week or so has been from wildfire smoke. There was no water under the tower, but the water level has come up slightly according to the water level and SHF data. Most of the wetland reeds have yellowing tips. I downloaded met, cam, and USB GHG data. There was a 7700 clock sync error when I arrived. I slightly adjusted the eddy clock: when it was 10:54, I set it to 10:56. I reset the box, which solved the clock sync error. The picam clock looked good. The tower is missing mid-day/afternoon data for about 10 days, 8/13-8/23. I’m not sure why, since the battery voltage has been around 13V when the data stop. Maybe there is a loose power connection somewhere. There have also been wasps and mud nests in the datalogger box the last few site visit, so I haven’t spent a lot of time looking at the wiring in there. 8/13 is also around when the water level sensor started seeing water, but it could be a coincidence with the missing data. The water level has remained about the same since then and the data is no longer dropping in the middle of the day. I cleaned flux and rad sensors. I topped off the wash reservoir. I noticed the 7700 was on default cleaning instead of our customized cleaning schedule, and I'm not sure how long it's been like this. I thought this could be why the wash reservoir here has always been full, but it looks like the default setting would clean even more frequently than our customized setting. In any case, the 7700 sensor has mostly remained clean enough, so our data has been fine. I swapped the LI-7500A for calibration: sn 0418 came off and sn 75H-2180 went on. I updated the configuration file, changed the pressure coefficient, and reset the box. LI-7500 readings (sn 0418 --> sn 0418 after cleaning --> sn 75H-2180): CO2 405ppm --> 408 --> 404 H2O 734ppm --> 740 --> 788 T 22.4C --> 23.4 --> 23.3 P 101.1kPa --> 101.1 --> 101.1 SS 90--> 92 --> 99 LI7700 readings: CH4 2.0ppm RSSI 20-->72 after cleaning I left at 12:05 PDT. |
1 photos found
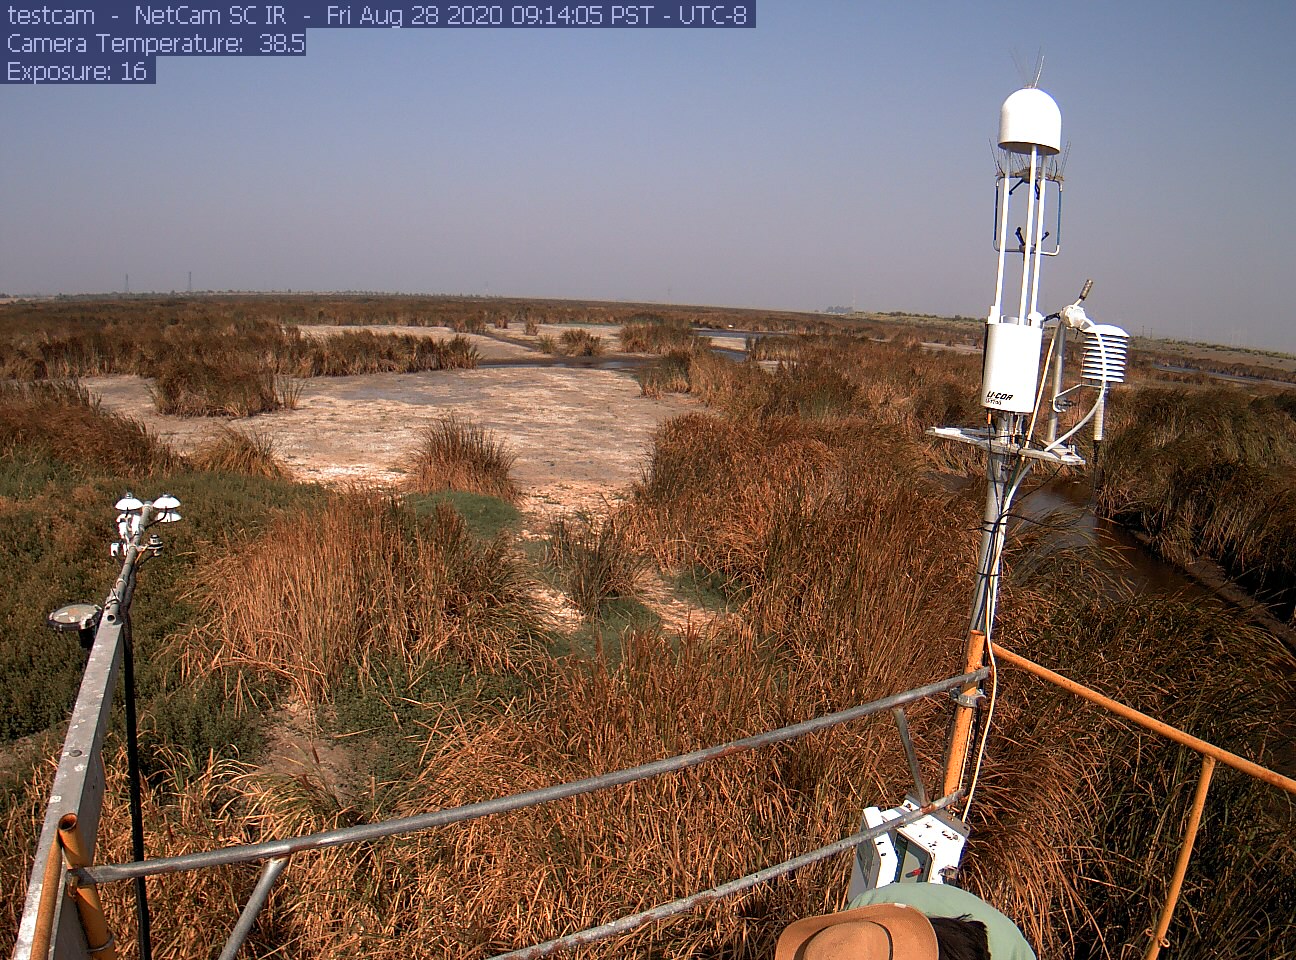
siwetland_2020_08_28_091405.jpg ( 2020-08-28 09:15:06 ) Full size: 1296x960
Daphne on site
7 sets found
Can't check MBWPEESWGT_mixed
Can't check MBEEWPSWEPGT_cam
16 SW_met graphs found
4 SW_flux graphs found
Can't check MBSWEEWPBCBA
Can't check SW_Temp
14 SW_Temp graphs found
3 SW_arable graphs found