
Field Notes
<--2019-04-16 10:30:00 | 2019-05-07 09:00:00-->Other sites visited today: Tonzi
Phenocam link: Searching...
Vaira: 2019-04-30 10:30:00 (DOY 120)
Author: Joe Verfaillie
Others: Daphne, Siyan, Kuno, Camilo, Jiangong
Summary: Regular fieldwork, Soil samples for moisture, C/N, microbial community, swapped 7500
| Vaira 2019-04-30 I arrived at about 10:30 with Daphne, Siyan, Kuno, Camilo and Jiangong. It was cool and mostly cloudy. Everything was green but the grass is beginning to brown in high spots. The grass has about tripled in height since last time. The ground is dry and hard at the surface. We met Dale Vaira and his wife on their way out. They were fixing some erosion of roads near the burn and having a picnic. Daphne swapped the 7500As for calibration: sn 75H-2176 came down, sn 75H-2668 went up. She uploaded a new config file, updated the pressure coefficients, reset the 7550 box, and downloaded USB GHG data. LI-7500 readings (sn 75H-2176 --> sn 75H-2668): CO2 407ppm --> 415 H2O 512ppm --> 497 T 16.4C --> 16.8 P 99.3kPa --> 99.3 SS 103--> 101 after swap Daphne also downloaded the met data and Phenocam photos, took clip plots and veg heights. I did the soil moisture measurements. I also installed an Arable Mark unit sn A001353 at the end of the radiation boom. This is for Arable and I need to set up the CR1000 to record 5min data for them but we should be able to get the data from the unit too. We also took spectra readings but the light was pretty variable due to the clouds. The others took soil samples. Kuno found a layer of ash at about 15cm below the surface. Four levels (0-10, 10-20, 20-30, 30-40 cm) were taken in six locations surrounding the tower site. Soils will be analyzed for soil moisture, C/N and Microbial community. We went to the pond for a look see and collected the data there. The pond level was 20.76ft |
Veg Height (cm): Tape measure from ground to top of plant - Measured by DS; 9 measurements each in 3 clip plot squares
46, 38, 36, 37, 23, 23, 23, 38, 43, 30, 48, 30, 43, 10, 18, 35, 29, 31, 16, 28, 29, 16, 41, 25, 13, 26, 26, avg = 29.7, stdev = 10.21
Field Data
No tank data
Well Depth
| Date | Location | Depth (feet) |
|---|---|---|
| 2019-04-30 | VR_well | 48.6 |
| 2019-04-30 | TZ_floor | 13.3 |
| 2019-04-30 | TZ_road | 22.55 |
| 2019-04-30 | TZ_tower | 17.3 |
| 2019-04-30 | VR_pond | 20.76 |
mode = both
Moisture Point Probes TZ
Array
(
[0] => Tower_1
[1] => Floor_South_1
[2] => Floor_West_1
[3] => Soil_Transect_3_1
[4] => Soil_Transect_2_1
[5] => SoilCO2_West_A_1
[6] => SoilCO2_West_B_1
[7] => SoilCO2_West_C_1
[8] => Tower_2
[9] => Floor_South_2
[10] => Floor_West_2
[11] => Soil_Transect_3_2
[12] => Soil_Transect_2_2
[13] => SoilCO2_West_A_2
[14] => SoilCO2_West_B_2
[15] => SoilCO2_West_C_2
[16] => Tower_3
[17] => Floor_South_3
[18] => Floor_West_3
[19] => Soil_Transect_4_3
[20] => Soil_Transect_3_3
[21] => Soil_Transect_2_3
[22] => Soil_Transect_1_3
[23] => SoilCO2_West_A_3
[24] => SoilCO2_West_B_3
[25] => SoilCO2_West_C_3
[26] => Tower_4
[27] => Floor_South_4
[28] => Floor_West_4
[29] => Soil_Transect_4_4
[30] => Soil_Transect_3_4
[31] => Soil_Transect_2_4
[32] => Soil_Transect_1_4
[33] => SoilCO2_West_A_4
[34] => SoilCO2_West_B_4
[35] => SoilCO2_West_C_4
[36] => Soil_Transect_4_1
[37] => Soil_Transect_1_1
[38] => Soil_Transect_4_2
[39] => Soil_Transect_1_2
)
| Date | DOY | Rep | Depth | Tower_1 |
Floor_South_1 |
Floor_West_1 |
Soil_Transect_3_1 |
Soil_Transect_2_1 |
SoilCO2_West_A_1 |
SoilCO2_West_B_1 |
SoilCO2_West_C_1 |
Tower_2 |
Floor_South_2 |
Floor_West_2 |
Soil_Transect_3_2 |
Soil_Transect_2_2 |
SoilCO2_West_A_2 |
SoilCO2_West_B_2 |
SoilCO2_West_C_2 |
Tower_3 |
Floor_South_3 |
Floor_West_3 |
Soil_Transect_4_3 |
Soil_Transect_3_3 |
Soil_Transect_2_3 |
Soil_Transect_1_3 |
SoilCO2_West_A_3 |
SoilCO2_West_B_3 |
SoilCO2_West_C_3 |
Tower_4 |
Floor_South_4 |
Floor_West_4 |
Soil_Transect_4_4 |
Soil_Transect_3_4 |
Soil_Transect_2_4 |
Soil_Transect_1_4 |
SoilCO2_West_A_4 |
SoilCO2_West_B_4 |
SoilCO2_West_C_4 |
Soil_Transect_4_1 |
Soil_Transect_1_1 |
Soil_Transect_4_2 |
Soil_Transect_1_2 |
Avg | Spacial Count |
Measurement Count |
|---|---|---|---|---|---|---|---|---|---|---|---|---|---|---|---|---|---|---|---|---|---|---|---|---|---|---|---|---|---|---|---|---|---|---|---|---|---|---|---|---|---|---|---|---|---|---|
| 2019-04-30 | 120 | 0 | nan | 15 | 8.3 | 16.8 | 6.8 | 13.8 | 15.6 | 15 | 3.6 | 23.4 | 16.7 | 21.9 | 22.5 | 46 | 19.1 | 8.4 | 21.3 | 26 | 34.9 | 29.3 | 19 | 23.5 | 59.2 | 25.1 | 29.6 | 27.1 | 31 | 39.4 | 50.6 | 43.7 | 25.4 | 39.1 | 56.9 | 22.8 | 42.3 | 44.3 | 46.6 | |||||||
| 2019-04-30 | 120 | 1 | nan | 15.6 | 8 | 13.8 | 6.8 | 6.6 | 14.4 | 14.7 | 2.7 | 23.7 | 17 | 21.6 | 22.2 | 44.8 | 19.1 | 7.8 | 21.6 | 26.2 | 34.6 | 28.2 | 19 | 23.7 | 53.6 | 26 | 29.3 | 27.1 | 31.5 | 38.5 | 52 | 43.4 | 25.1 | 38.5 | 49.1 | 23.1 | 42.5 | 44.5 | 48.3 | 4.2 | 10.1 | 16.7 | 10 | |||
| 2019-04-30 | 120 | 2 | nan | 19 | 25.4 | 25.9 | 23.1 | 4.2 | 9.7 | 16.7 | 10.3 | |||||||||||||||||||||||||||||||||||
| 2019-04-30 | 120 | Avg | 0-15cm | 0 | 0 | |||||||||||||||||||||||||||||||||||||||||
| 2019-04-30 | 120 | Avg | 15-30cm | 0 | 0 | |||||||||||||||||||||||||||||||||||||||||
| 2019-04-30 | 120 | Avg | 30-45cm | 0 | 0 | |||||||||||||||||||||||||||||||||||||||||
| 2019-04-30 | 120 | Avg | 45-60cm | 0 | 0 |
mode = both
Moisture Point Probes VR
Array
(
[0] => Solar_Panels_1
[1] => Flux_Tower_1
[2] => Biomass_Cage_1
[3] => Solar_Panels_2
[4] => Flux_Tower_2
[5] => Biomass_Cage_2
[6] => Solar_Panels_3
[7] => Biomass_Cage_3
[8] => Solar_Panels_4
[9] => Biomass_Cage_4
[10] => Flux_Tower_3
[11] => Flux_Tower_4
)
| Date | DOY | Rep | Depth | Solar_Panels_1 |
Flux_Tower_1 |
Biomass_Cage_1 |
Solar_Panels_2 |
Flux_Tower_2 |
Biomass_Cage_2 |
Solar_Panels_3 |
Biomass_Cage_3 |
Solar_Panels_4 |
Biomass_Cage_4 |
Flux_Tower_3 |
Flux_Tower_4 |
Avg | Spacial Count |
Measurement Count |
|---|---|---|---|---|---|---|---|---|---|---|---|---|---|---|---|---|---|---|
| 2019-04-30 | 120 | 0 | nan | 8.3 | 5.3 | 4.7 | 14.2 | 17.6 | 10.3 | 21.5 | 21.8 | 35.7 | 23.4 | |||||
| 2019-04-30 | 120 | 1 | nan | 10.9 | 5.6 | 5 | 14.2 | 17.3 | 10.6 | 20.7 | 21.2 | 36.2 | 23.4 | 9.2 | 20.8 | |||
| 2019-04-30 | 120 | 2 | nan | 5 | 17.3 | 9.5 | 20.8 | |||||||||||
| 2019-04-30 | 120 | Avg | 0-15cm | 0 | 0 | |||||||||||||
| 2019-04-30 | 120 | Avg | 15-30cm | 0 | 0 | |||||||||||||
| 2019-04-30 | 120 | Avg | 30-45cm | 0 | 0 | |||||||||||||
| 2019-04-30 | 120 | Avg | 45-60cm | 0 | 0 |
No TZ grass heigth found
No VR grass heigth found
No VR Tree DBH found
No water potential data found
No VR Grass Biomass data found
No VR OakLeaves Biomass data found
No VR PineNeedles Biomass data found
5 photos found
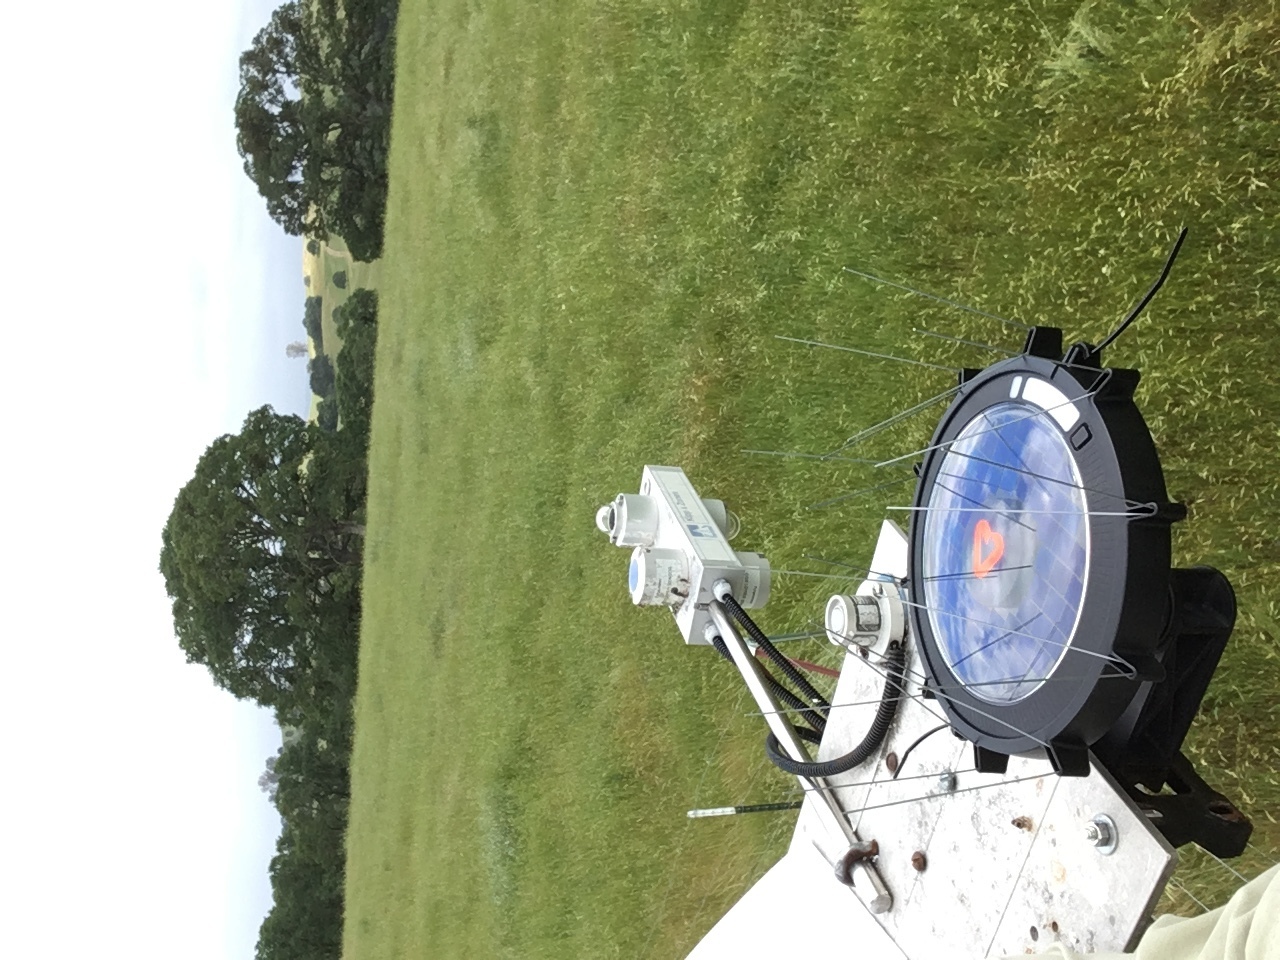
20190430VR_NewArable.jpg ( 2019-04-30 11:31:52 ) Full size: 1280x960
New Arable Mark mounted on end or radiation boom

20190430VR_KunocamiloSoilsampling.JPG ( 2019-04-30 10:41:44 ) Full size: 1920x1440
Kuno and Camilo sampling soils at Vaira.

20190430VR_SiyanJiangongSoilsampling.JPG ( 2019-04-30 11:11:22 ) Full size: 1920x1440
Siyan and Jiangong sampling soils at Vaira.

20190430VR_Soilsampling.JPG ( 2019-04-30 11:20:31 ) Full size: 1920x1440
Kuno and Camilo sampling soils at Vaira.

vaira_2019_04_30_100121.jpg ( 2019-04-30 10:58:36 ) Full size: 1296x960
Taking soil samples
9 sets found
16 VR_met graphs found
2 VR_flux graphs found
6 VR_soilco2 graphs found
2 VR_pond graphs found
Can't check TZVR_mixed
No data found for VR_fd.
No data found for VR_processed.
No data found for VR_arable.
No data found for VR_soilvue.