
Field Notes
<--2019-04-16 11:30:00 | 2019-05-07 09:30:00-->Other sites visited today: Vaira
Phenocam link: Searching...
Tonzi: 2019-04-30 12:30:00 (DOY 120)
Author: Joe Verfaillie
Others: Daphne, Siyan, Kuno, Camilo, Jiangong
Summary: Tower power down and Tower Licor box dead, moved Floor IRGA to Tower, swapped 7500 for calibration, Soil samples for moisture, C/N, microbial community, gate combo lock broken
| Tonzi 2019-04-30 I arrived at about 12:30 with Daphne, Siyan, Kuno, Camilo and Jiangong. It was cool and partly cloudy. Everything is very green but the ground surface has dried out (no puddles left) and the pond has begun to shrink. The Tower solar system had popped its 5A breaker on its load line so no power since 4-23. Resetting the breaker seemed to restore power. Daphne went to swap the Tower 7500A for calibration but the 7550 had power issues – maybe the reason the breaker was thrown. The power LED light was blinking (there was a clicking sound with each blink). The 7550 would start up ok if the IRGA was disconnected, but would crash as soon as an IRGA was connected. We ended up stealing the 7550 from the Floor. We brought the Tower 7550 sn AIU-1866 back to the lab to check out and moved sn AIU-1869 from the Floor to the tower and renamed it from TF-1869 to TT-1869. She connected a freshly calibrated head, sn 1594, uploaded a new config file, updated the pressure coefficients, and reset the 7550. She confirmed the USB was logging and the GHG columns looked ok. So the Tower lost about six days of data and now the Floor will lose about six days of data until I can install another IRGA. Head sn 0041 was removed from the Floor and head sn 0042 was removed from the tower for calibration. LI-7500 readings (sn 1594; no before-cleaning readings b/c 7550 crashed): CO2 411ppm H2O 436ppm T 17.0C P 98.9kPa SS 102 Daphne also swapped the 12V fan for the Tower CO2 profile HMP. She also did clip plots. The LattePanda was okay after power was restored and it was rebooted. All the FLIR images had been correctly renamed to the micro SD card. I initially had some problems with the Quatech serial box but that solved itself after I rebooted the LattePanda. New data was coming in from the remote data loggers and images from the FLIR. I did the soil moisture measurements, serviced the z-cams, did the manual well measurements, and read the dendrometers. Cows have chewed the cable to the Floor well but it was still connected and working. The road well was reading above its 15ft max. I raised the well sensors until it read 12.002ft. The others took soil samples for soil moisture, C/N, and microbial community. Four levels (0-10, 10-20, 20-30, 30-40 cm) were taken in twelve locations in open locations and near trees. Kuno found an ash layer at about 40cm. On the way out the combo lock on the gate would not latch. We used the main lock to fasten the gate and brought the combo lock home for replacement. |
Field Data
No tank data
Well Depth
| Date | Location | Depth (feet) |
|---|---|---|
| 2019-04-30 | VR_well | 48.6 |
| 2019-04-30 | TZ_floor | 13.3 |
| 2019-04-30 | TZ_road | 22.55 |
| 2019-04-30 | TZ_tower | 17.3 |
| 2019-04-30 | VR_pond | 20.76 |
mode = both
Moisture Point Probes TZ
Array
(
[0] => Tower_1
[1] => Floor_South_1
[2] => Floor_West_1
[3] => Soil_Transect_3_1
[4] => Soil_Transect_2_1
[5] => SoilCO2_West_A_1
[6] => SoilCO2_West_B_1
[7] => SoilCO2_West_C_1
[8] => Tower_2
[9] => Floor_South_2
[10] => Floor_West_2
[11] => Soil_Transect_3_2
[12] => Soil_Transect_2_2
[13] => SoilCO2_West_A_2
[14] => SoilCO2_West_B_2
[15] => SoilCO2_West_C_2
[16] => Tower_3
[17] => Floor_South_3
[18] => Floor_West_3
[19] => Soil_Transect_4_3
[20] => Soil_Transect_3_3
[21] => Soil_Transect_2_3
[22] => Soil_Transect_1_3
[23] => SoilCO2_West_A_3
[24] => SoilCO2_West_B_3
[25] => SoilCO2_West_C_3
[26] => Tower_4
[27] => Floor_South_4
[28] => Floor_West_4
[29] => Soil_Transect_4_4
[30] => Soil_Transect_3_4
[31] => Soil_Transect_2_4
[32] => Soil_Transect_1_4
[33] => SoilCO2_West_A_4
[34] => SoilCO2_West_B_4
[35] => SoilCO2_West_C_4
[36] => Soil_Transect_4_1
[37] => Soil_Transect_1_1
[38] => Soil_Transect_4_2
[39] => Soil_Transect_1_2
)
| Date | DOY | Rep | Depth | Tower_1 |
Floor_South_1 |
Floor_West_1 |
Soil_Transect_3_1 |
Soil_Transect_2_1 |
SoilCO2_West_A_1 |
SoilCO2_West_B_1 |
SoilCO2_West_C_1 |
Tower_2 |
Floor_South_2 |
Floor_West_2 |
Soil_Transect_3_2 |
Soil_Transect_2_2 |
SoilCO2_West_A_2 |
SoilCO2_West_B_2 |
SoilCO2_West_C_2 |
Tower_3 |
Floor_South_3 |
Floor_West_3 |
Soil_Transect_4_3 |
Soil_Transect_3_3 |
Soil_Transect_2_3 |
Soil_Transect_1_3 |
SoilCO2_West_A_3 |
SoilCO2_West_B_3 |
SoilCO2_West_C_3 |
Tower_4 |
Floor_South_4 |
Floor_West_4 |
Soil_Transect_4_4 |
Soil_Transect_3_4 |
Soil_Transect_2_4 |
Soil_Transect_1_4 |
SoilCO2_West_A_4 |
SoilCO2_West_B_4 |
SoilCO2_West_C_4 |
Soil_Transect_4_1 |
Soil_Transect_1_1 |
Soil_Transect_4_2 |
Soil_Transect_1_2 |
Avg | Spacial Count |
Measurement Count |
|---|---|---|---|---|---|---|---|---|---|---|---|---|---|---|---|---|---|---|---|---|---|---|---|---|---|---|---|---|---|---|---|---|---|---|---|---|---|---|---|---|---|---|---|---|---|---|
| 2019-04-30 | 120 | 0 | nan | 15 | 8.3 | 16.8 | 6.8 | 13.8 | 15.6 | 15 | 3.6 | 23.4 | 16.7 | 21.9 | 22.5 | 46 | 19.1 | 8.4 | 21.3 | 26 | 34.9 | 29.3 | 19 | 23.5 | 59.2 | 25.1 | 29.6 | 27.1 | 31 | 39.4 | 50.6 | 43.7 | 25.4 | 39.1 | 56.9 | 22.8 | 42.3 | 44.3 | 46.6 | |||||||
| 2019-04-30 | 120 | 1 | nan | 15.6 | 8 | 13.8 | 6.8 | 6.6 | 14.4 | 14.7 | 2.7 | 23.7 | 17 | 21.6 | 22.2 | 44.8 | 19.1 | 7.8 | 21.6 | 26.2 | 34.6 | 28.2 | 19 | 23.7 | 53.6 | 26 | 29.3 | 27.1 | 31.5 | 38.5 | 52 | 43.4 | 25.1 | 38.5 | 49.1 | 23.1 | 42.5 | 44.5 | 48.3 | 4.2 | 10.1 | 16.7 | 10 | |||
| 2019-04-30 | 120 | 2 | nan | 19 | 25.4 | 25.9 | 23.1 | 4.2 | 9.7 | 16.7 | 10.3 | |||||||||||||||||||||||||||||||||||
| 2019-04-30 | 120 | Avg | 0-15cm | 0 | 0 | |||||||||||||||||||||||||||||||||||||||||
| 2019-04-30 | 120 | Avg | 15-30cm | 0 | 0 | |||||||||||||||||||||||||||||||||||||||||
| 2019-04-30 | 120 | Avg | 30-45cm | 0 | 0 | |||||||||||||||||||||||||||||||||||||||||
| 2019-04-30 | 120 | Avg | 45-60cm | 0 | 0 |
mode = both
Moisture Point Probes VR
Array
(
[0] => Solar_Panels_1
[1] => Flux_Tower_1
[2] => Biomass_Cage_1
[3] => Solar_Panels_2
[4] => Flux_Tower_2
[5] => Biomass_Cage_2
[6] => Solar_Panels_3
[7] => Biomass_Cage_3
[8] => Solar_Panels_4
[9] => Biomass_Cage_4
[10] => Flux_Tower_3
[11] => Flux_Tower_4
)
| Date | DOY | Rep | Depth | Solar_Panels_1 |
Flux_Tower_1 |
Biomass_Cage_1 |
Solar_Panels_2 |
Flux_Tower_2 |
Biomass_Cage_2 |
Solar_Panels_3 |
Biomass_Cage_3 |
Solar_Panels_4 |
Biomass_Cage_4 |
Flux_Tower_3 |
Flux_Tower_4 |
Avg | Spacial Count |
Measurement Count |
|---|---|---|---|---|---|---|---|---|---|---|---|---|---|---|---|---|---|---|
| 2019-04-30 | 120 | 0 | nan | 8.3 | 5.3 | 4.7 | 14.2 | 17.6 | 10.3 | 21.5 | 21.8 | 35.7 | 23.4 | |||||
| 2019-04-30 | 120 | 1 | nan | 10.9 | 5.6 | 5 | 14.2 | 17.3 | 10.6 | 20.7 | 21.2 | 36.2 | 23.4 | 9.2 | 20.8 | |||
| 2019-04-30 | 120 | 2 | nan | 5 | 17.3 | 9.5 | 20.8 | |||||||||||
| 2019-04-30 | 120 | Avg | 0-15cm | 0 | 0 | |||||||||||||
| 2019-04-30 | 120 | Avg | 15-30cm | 0 | 0 | |||||||||||||
| 2019-04-30 | 120 | Avg | 30-45cm | 0 | 0 | |||||||||||||
| 2019-04-30 | 120 | Avg | 45-60cm | 0 | 0 |
No TZ grass heigth found
No VR grass heigth found
Tree DBH
| Date | Tag# | Reading (mm) |
|---|---|---|
| 2019-04-30 | 1 | 14.4 |
| 2019-04-30 | 102 | 18.8 |
| 2019-04-30 | 2 | 13.1 |
| 2019-04-30 | 245 | 10.6 |
| 2019-04-30 | 3 | 12.3 |
| 2019-04-30 | 4 | 4.9 |
| 2019-04-30 | 6 | 11.7 |
| 2019-04-30 | 7 | 18.2 |
| 2019-04-30 | 72 | 20.0 |
| 2019-04-30 | 79 | 15.7 |
| 2019-04-30 | 8 | 7.7 |
No water potential data found
No TZ Grass Biomass data found
No TZ OakLeaves Biomass data found
No TZ PineNeedles Biomass data found
4 photos found
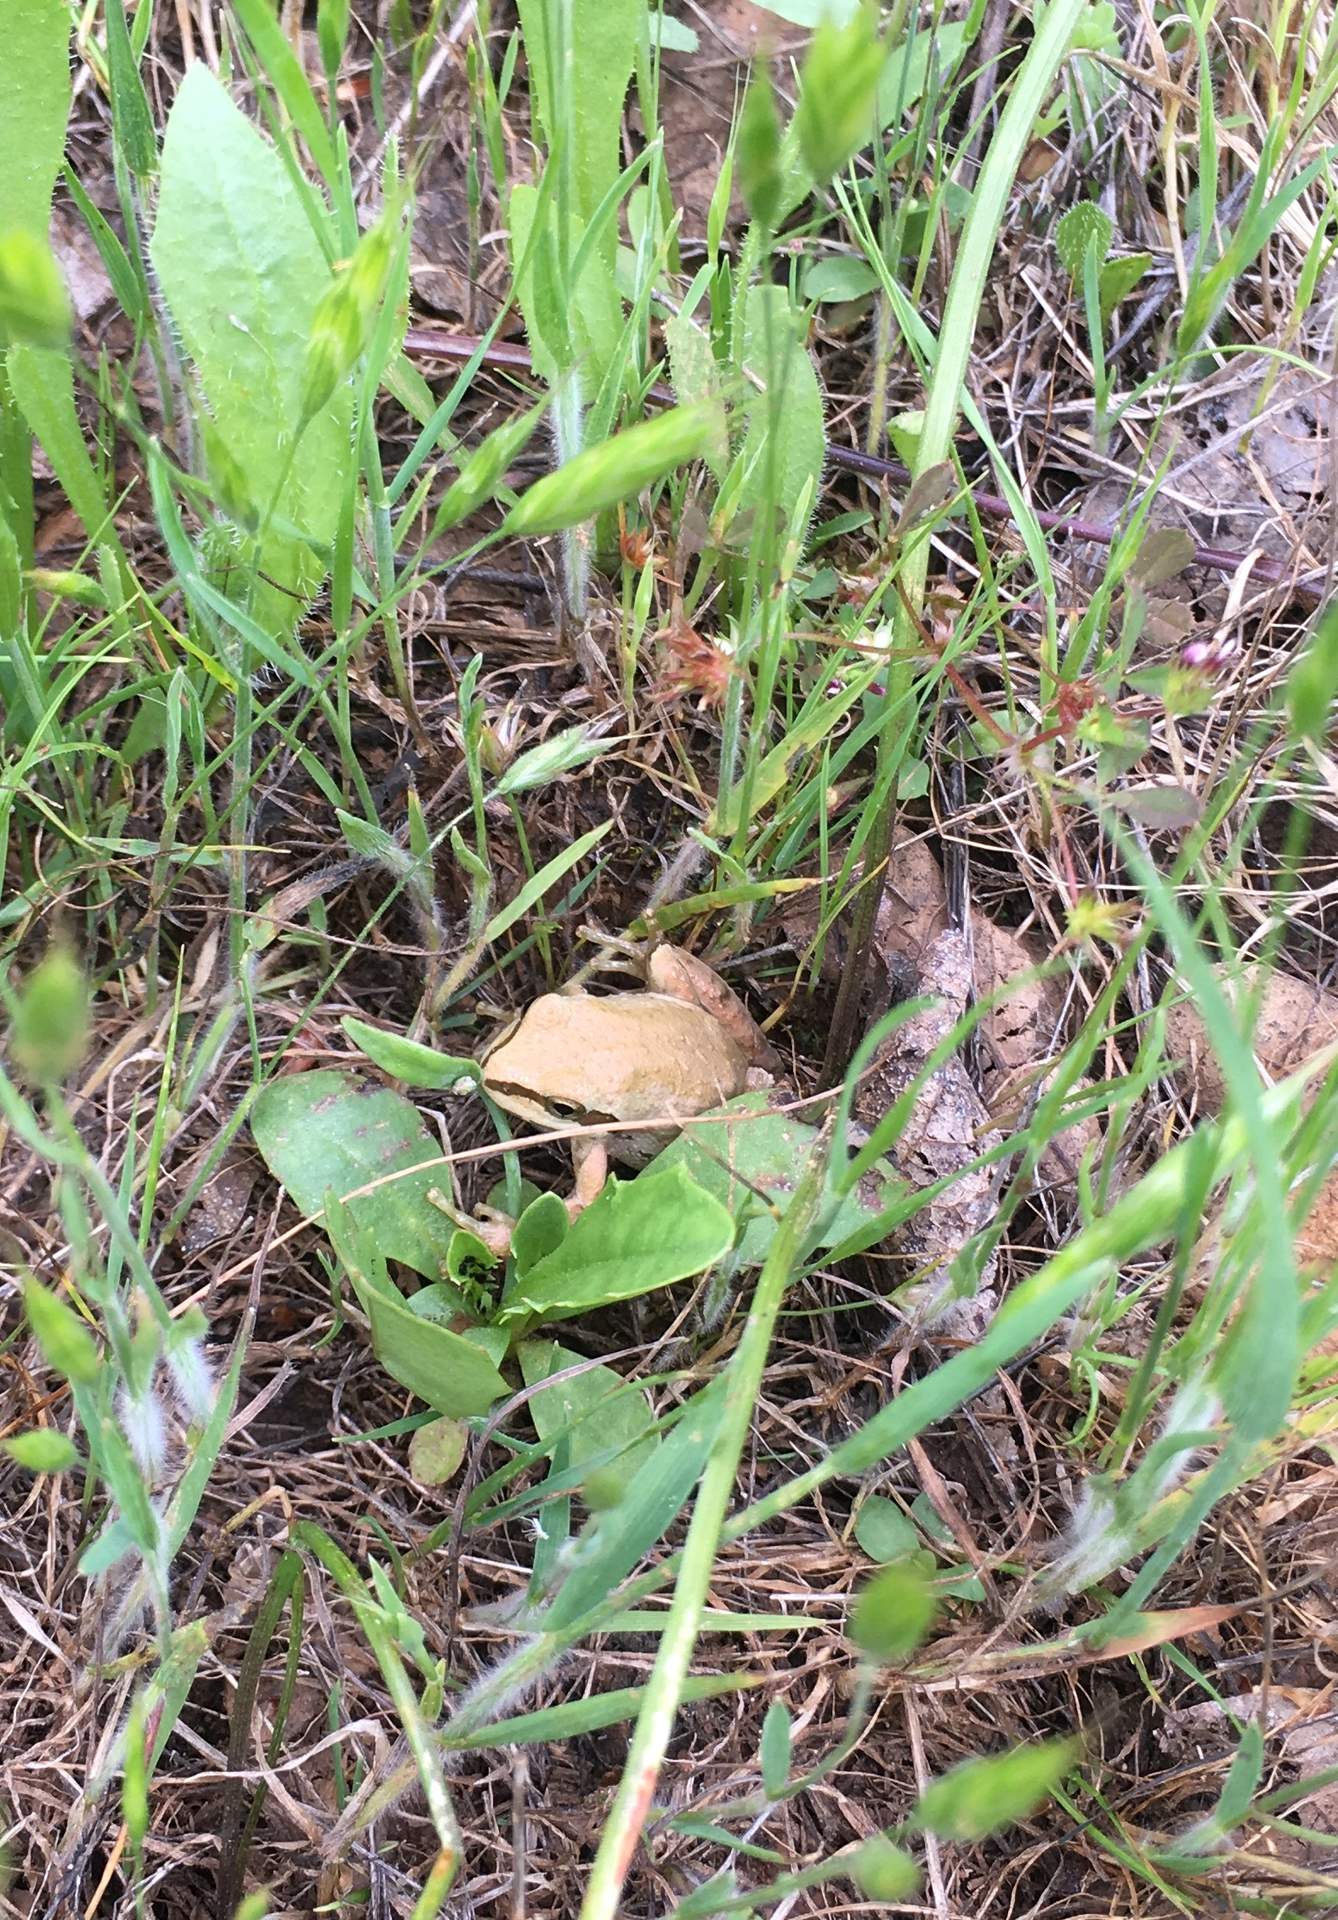
20190430TZ_Frog.jpg ( 2019-04-30 14:32:17 ) Full size: 1338x1920
Tree frog in the grass
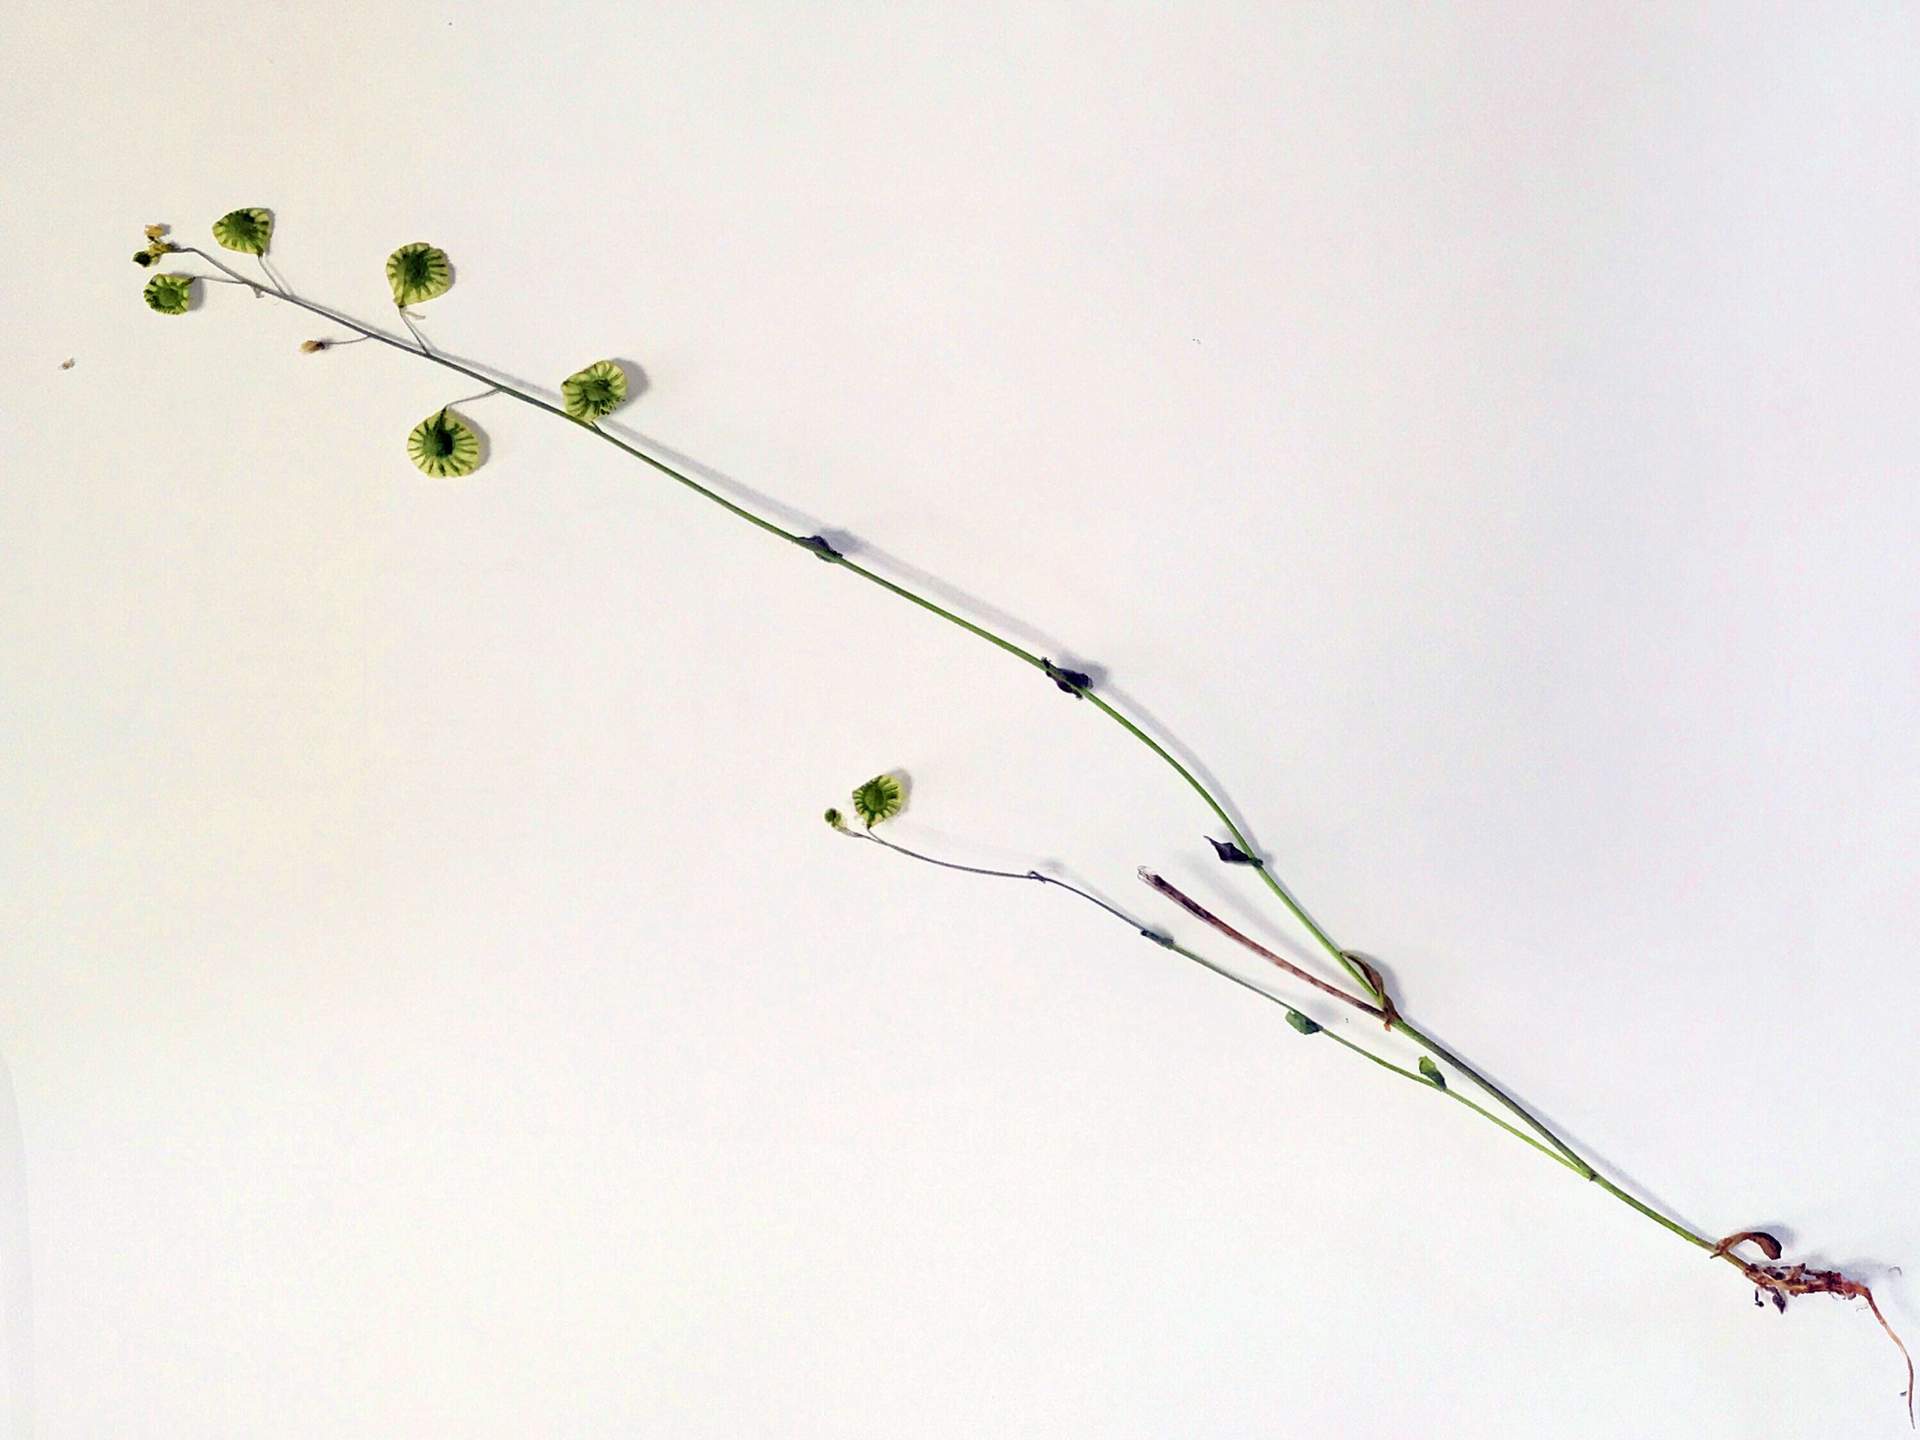
20190430TZ_FringePod-Thysanocarpus_radians_1.jpg ( 2019-04-30 14:00:00 ) Full size: 1920x1440
Thysanocarpus radians, a dicot, is an annual herb that is native to California, is also found outside of California, but is confined to western North America
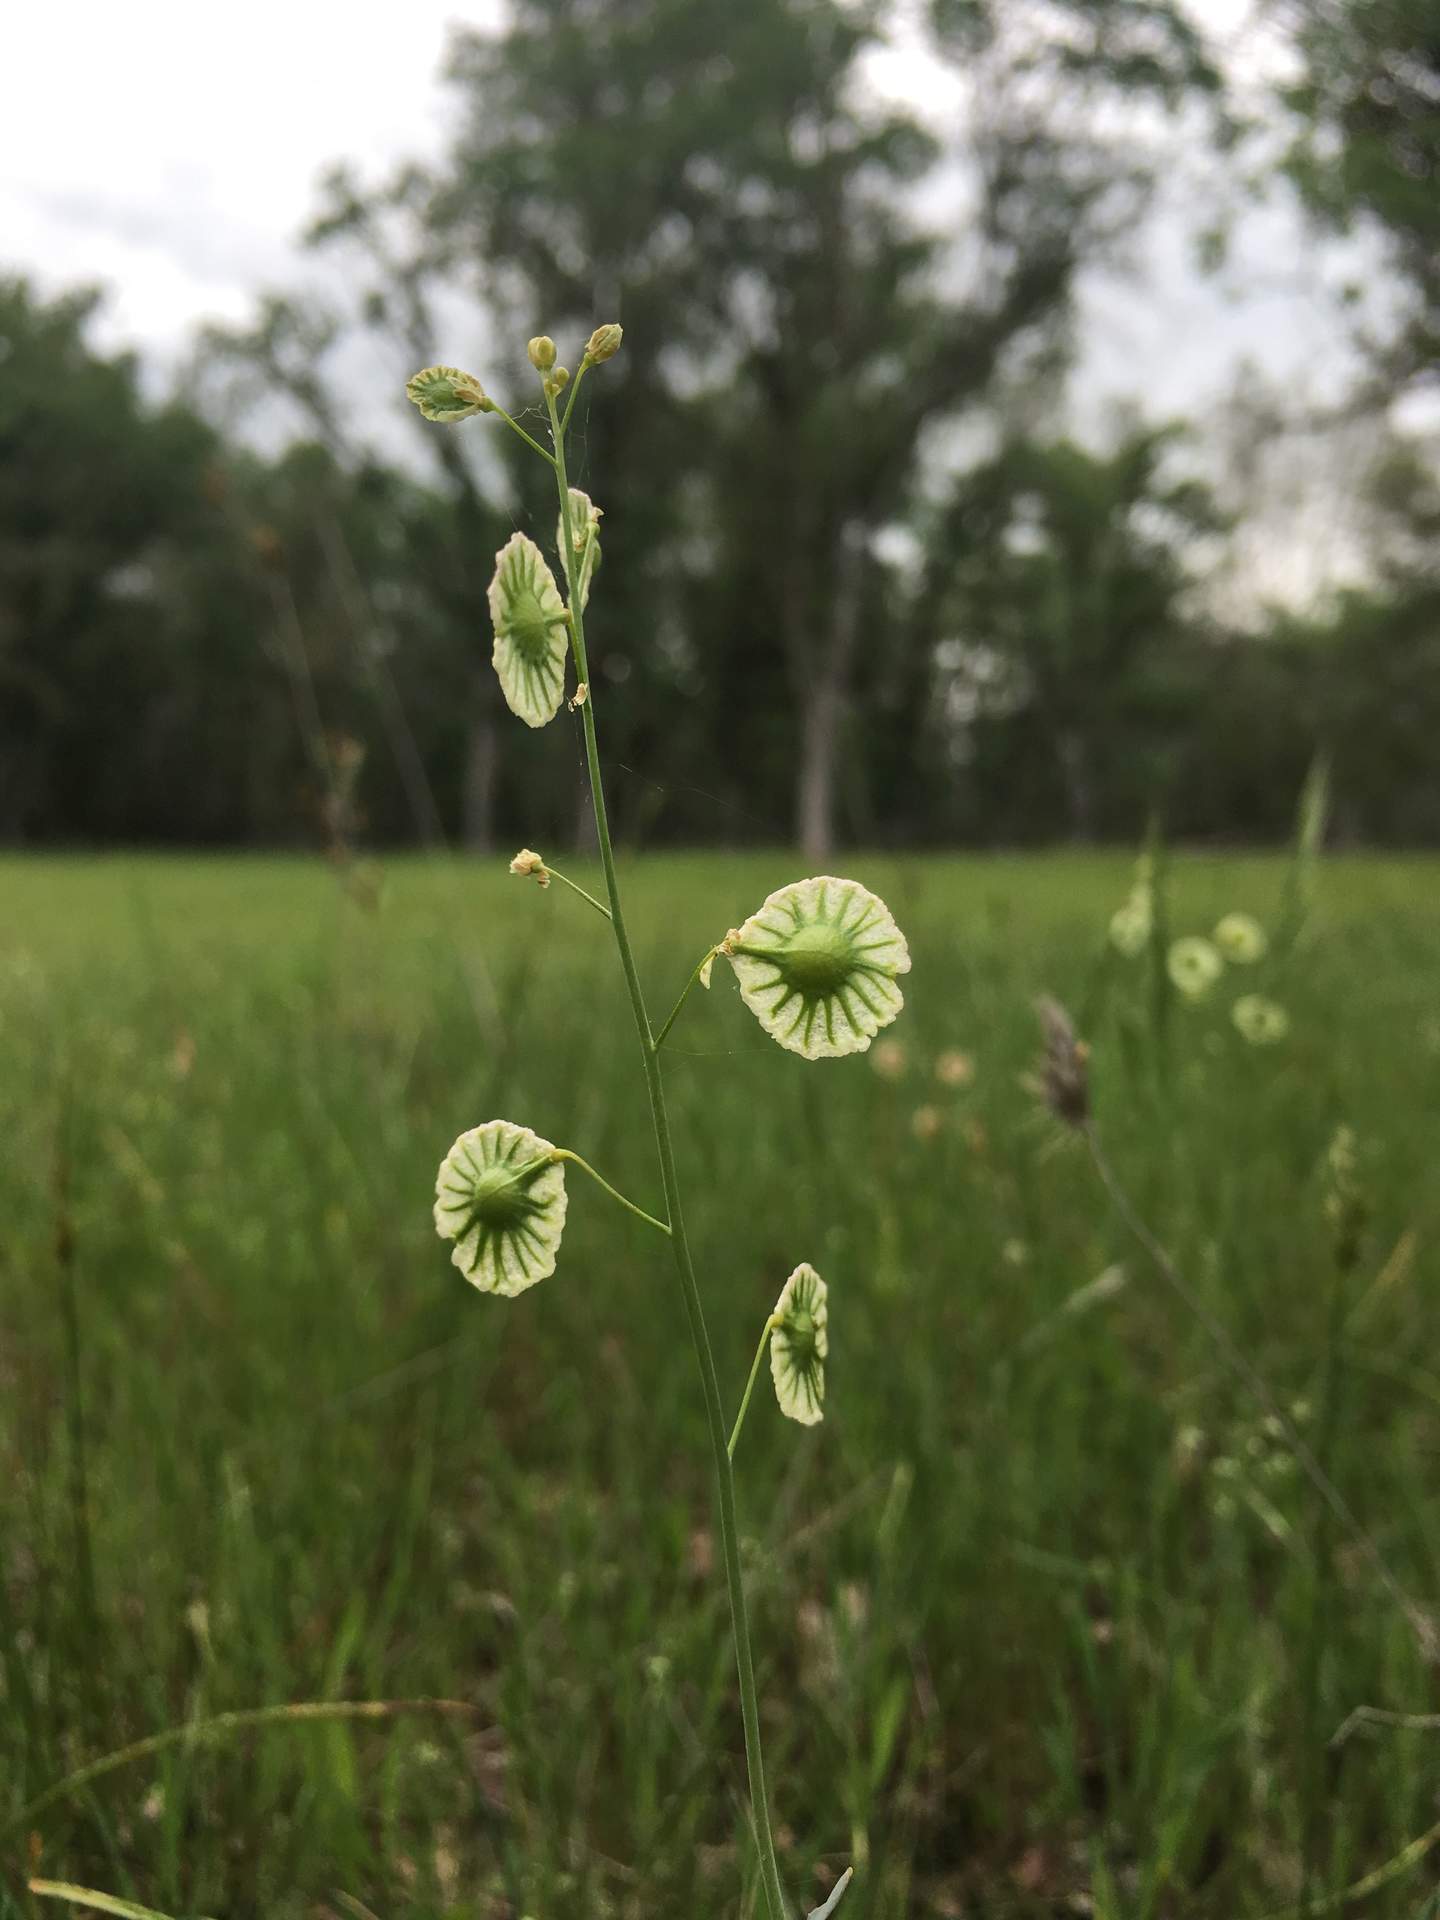
20190430TZ_FringePod-Thysanocarpus_radians_3.jpg ( 2019-04-30 14:40:03 ) Full size: 1440x1920
Thysanocarpus radians, a dicot, is an annual herb that is native to California, is also found outside of California, but is confined to western North America

20190430TZ_RattlesnakeGRass-Briza_maxima_2.jpg ( 2019-04-30 14:00:00 ) Full size: 1127x1602
Briza maxima, a monocot, is an annual grass that is not native to California; it was introduced from elsewhere and naturalized in the wild. Cal-IPC rating: Limited
16 sets found
No data found for TZ_Fenergy.
11 TZ_tmet graphs found
11 TZ_soilco2 graphs found
Can't check TZ_mixed
3 TZ_mixed graphs found
1 TZ_fflux graphs found
8 TZ_fmet graphs found
No data found for TZ_tram.
3 TZ_co2prof graphs found
1 TZ_irt graphs found
No data found for TZ_windprof.
1 TZ_tflux graphs found
2 TZ_sm graphs found
Can't check TZ_met
1 TZ_met graphs found
Can't check TZVR_mixed
8 TZ_osu graphs found
No data found for TZ_fd.
Tonzi Z-cam data