
Field Notes
<--2018-07-25 09:00:00 | 2018-08-07 13:56:00-->Other sites visited today: Mayberry | Sherman Wetland | West Pond | East End | East Pond | Bouldin Alfalfa | Bouldin Corn
Phenocam link: Searching...
Sherman Barn: 2018-07-26 14:45:00 (DOY 207)
Author: Daphne Szutu
Others: Dennis, Alex, Kuno
Summary: Regular data collection/cleaning
| 2018-07-26 Sherman Barn We arrived at 14:45. It was sunny and windy, with low, smoky haze from fires covering the top of Mt. Diablo. Dennis trimmed some of the weeds under the radiometers. Tyler and co. had collected 45 samples the previous day (3 transects, 5 points along the transect, 3 depths at each point) and (?) installed some chambers along the ditch, east of the exclosure. The sonic heading was 319 deg (NW). The wash reservoir was ¼ empty; Dennis refilled it. Kuno and Alex cleaned flux and rad sensors. I downloaded met, camera, and USB GHG data. I forgot to change the photo text overlay for the phenocam photos, so the photos need to be stamped with “shermanbarn†to cover their “twitchellalfalfa†text. The 7500 read: 396ppm CO2, 760mmol/m3 H2O, 30.5C, 101.3kPa, 97SS --> 98 after cleaning The 7700 read: 1.94ppm CH4, 52RSSI –> 71 after cleaning. We left at around 15:05. |
1 photos found
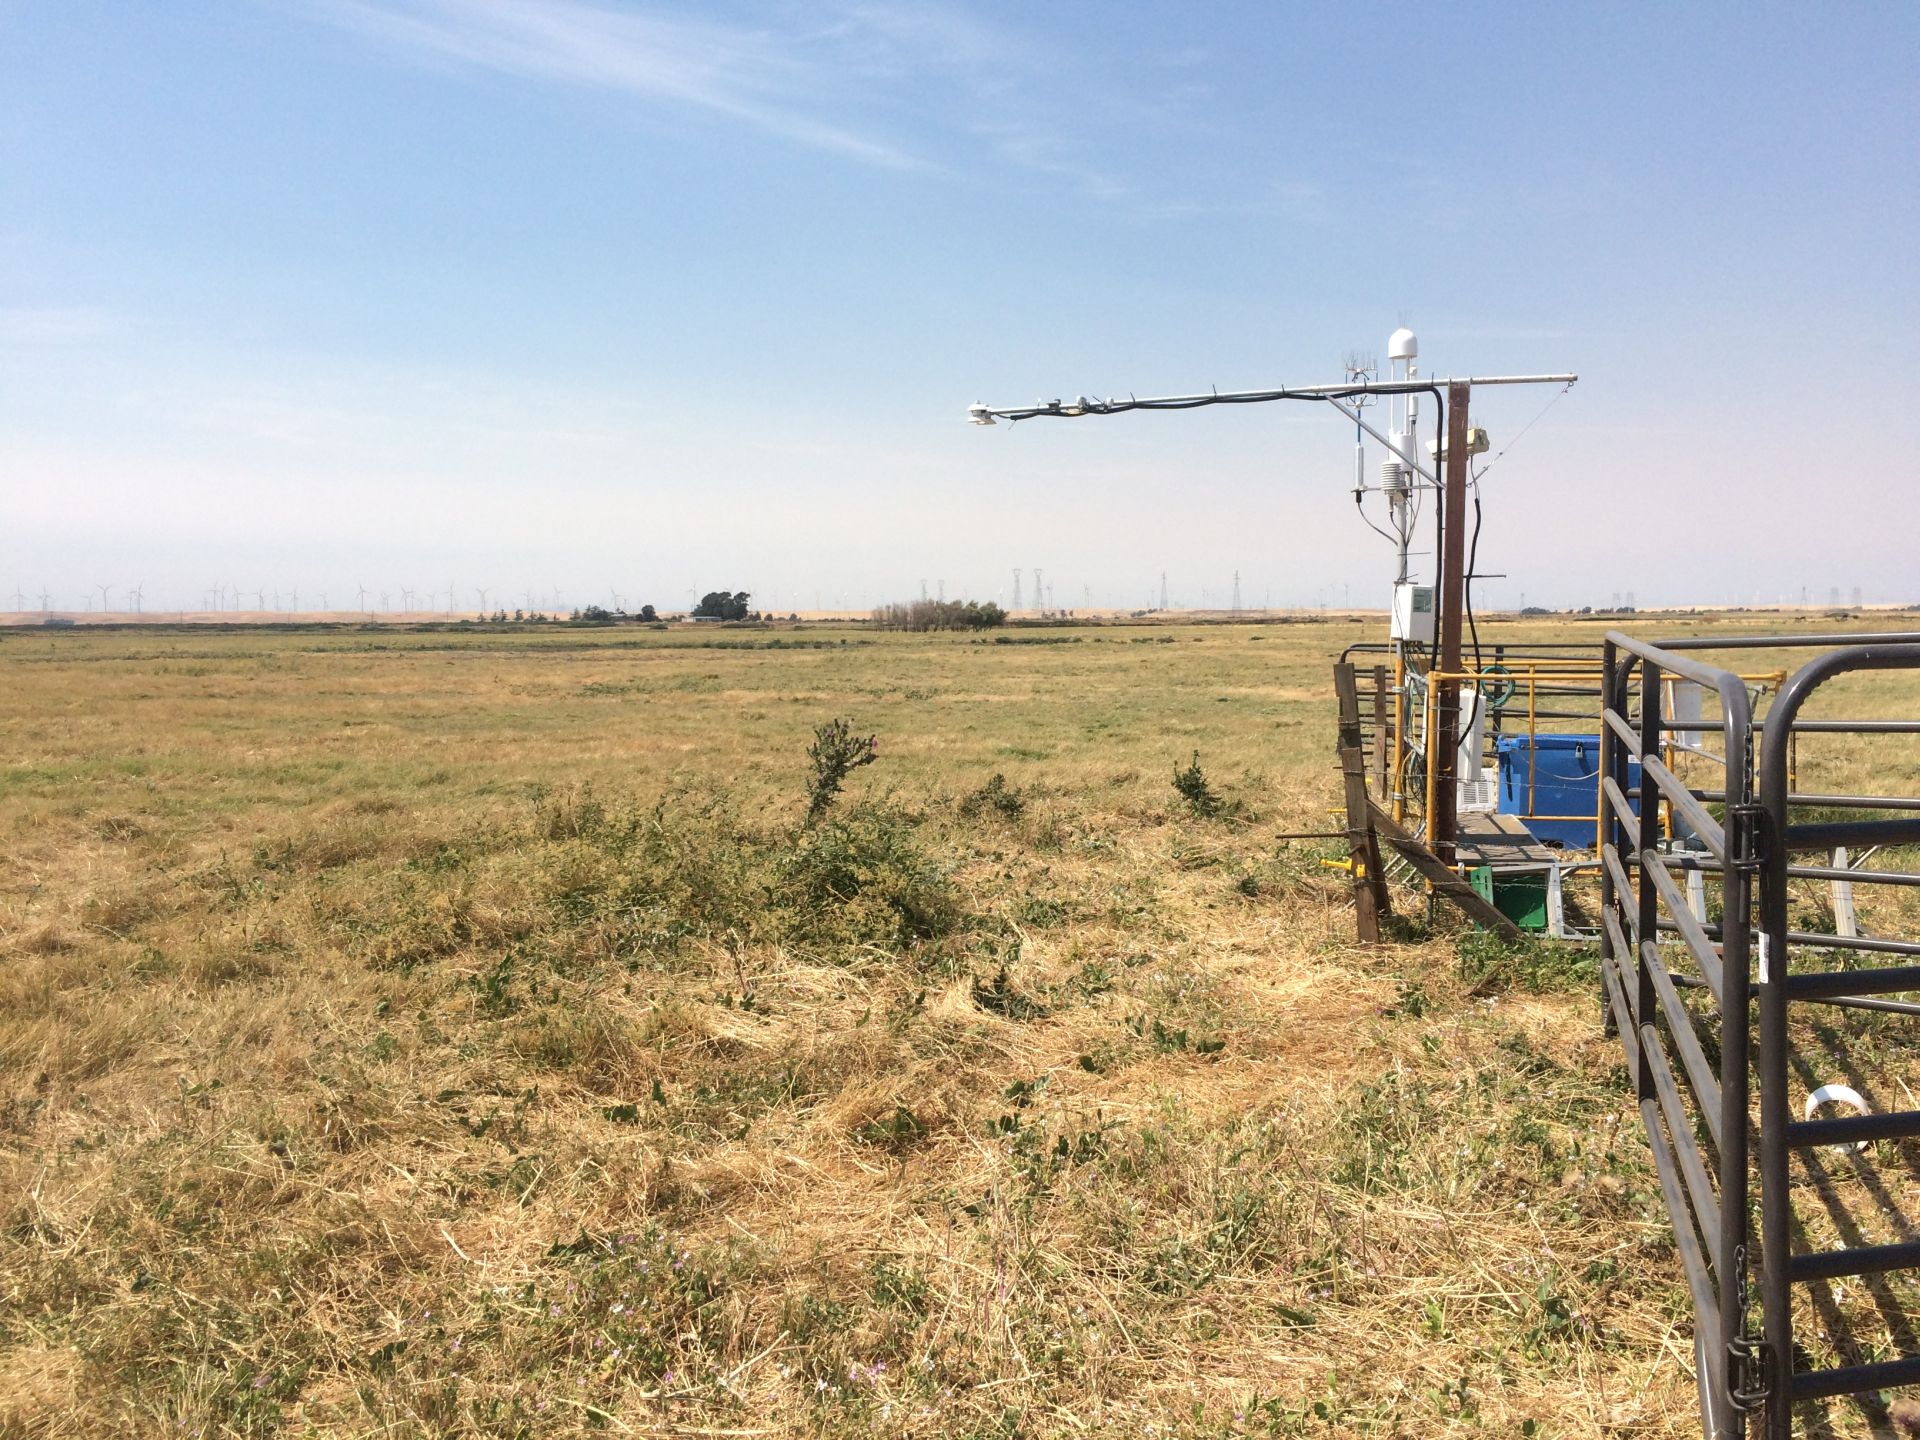
20180726SB_WeedsunderRadiometers.JPG ( 2018-07-26 14:56:43 ) Full size: 1920x1440
Weeds under Sherman Barn radiometer that Dennis trimmed away.
3 sets found
4 SB_flux graphs found
15 SB_met graphs found
Can't check TATWBABCSB_cam