Field Notes

<--2018-07-11 13:05:00 | 2018-08-07 14:41:00-->
Other sites visited today: Mayberry | Sherman Barn | West Pond | East End | East Pond | Bouldin Alfalfa | Bouldin Corn

Sherman Wetland: 2018-07-26 15:20:00 (DOY 207)
Author: Daphne Szutu
Others: Dennis, Alex, Kuno

Summary: Regular data collection/cleaning

2018-07-26
Sherman Wetland

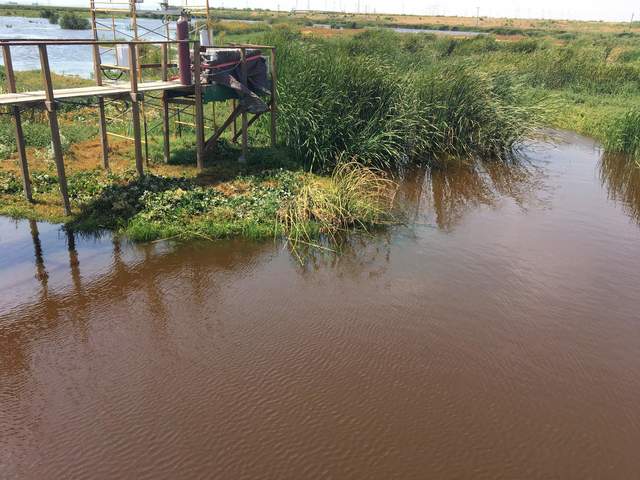
We arrived at 15:20. It was windy but warm, with high clouds and smoke around Mt. Diablo but good visibility otherwise. The water level was 53 cm. The tules we transplanted two weeks ago are turning brown and look like they might not survive.

Dennis refilled the wash reservoir; it was ¾ full. Kuno cleaned the flux and rad sensors. I downloaded met, camera, and USB data. I accidentally put the full BC camera card into the datalogger instead of the empty SW camera card, so next time this camera card will have both BC and SW photos.

The 7500 read: 393ppm CO2, 824mmol/m3 H2O, 28.9C, 101.2kPa, 104SS --> 105 after cleaning
The 7700 read: 2.1ppm CH4, 17RSSI –> 68 after cleaning.

We left around 15:45.

2 photos found

Tules at Sherman Wetland are looking brown 2 weeks after transplanting.
20180726SW_TransplantedTules.jpg ( 2018-07-26 15:17:28 ) Full size: 1920x1440
Tules at Sherman Wetland are looking brown 2 weeks after transplanting.
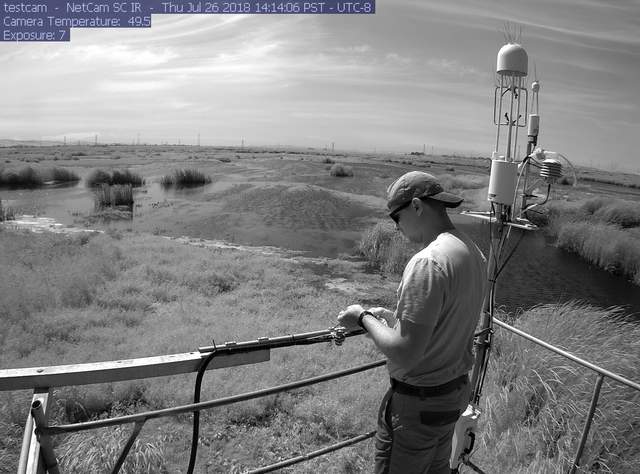
Kuno in NIR
siwetland_IR_2018_07_26_141406.jpg ( 2018-07-26 14:19:56 ) Full size: 1296x960
Kuno in NIR

Graphs display:
7 sets found

Can't check MBWPEESWGT_mixed
Can't check MBEEWPSWEPGT_cam
16 SW_met graphs found

Explore the graph:Temperatures in a new window

Explore the graph:Water Temperature Profile A in a new window

Explore the graph:Water Temperature Profile B in a new window

Explore the graph:Soil Temperature Profile C2 in a new window

Explore the graph:Soil Heat Flux in a new window

Explore the graph:Four channel Radiometer in a new window

Explore the graph:Sherman Wetland PAR in a new window

Explore the graph:PRI Channels in a new window

Explore the graph:NDVI Channels in a new window

Explore the graph:Water level and Rain in a new window

Explore the graph:Dissolved CO2 in a new window

Explore the graph:Air Pressure in a new window

Explore the graph:Battery Voltage and RH in a new window

Explore the graph:Soil Temperature Profile C1 in a new window

Explore the graph:SRS NDVI and PRI in a new window

Explore the graph:SW miniDOT Dissolved Oxygen in a new window

4 SW_flux graphs found

Explore the graph:CO2 and H2O in a new window

Explore the graph:Wind in a new window

Explore the graph:Methane in a new window

Explore the graph:Data Counts in a new window

Can't check MBSWEEWPBCBA
Can't check SW_Temp
14 SW_Temp graphs found

Explore the graph:Temperatures in a new window

Explore the graph:CO2 and H2O in a new window

Explore the graph:Wind in a new window

Explore the graph:Methane in a new window

Explore the graph:Data Counts in a new window

Explore the graph:Temperature Profile A in a new window

Explore the graph:Temperature Profile B in a new window

Explore the graph:Temperature Profile C in a new window

Explore the graph:Soil Heat Flux in a new window

Explore the graph:Four-channel radiometer in a new window

Explore the graph:NDVI Channels in a new window

Explore the graph:PAR in a new window

Explore the graph:Air Pressure and Water Level in a new window

Explore the graph:Air T and RH in a new window

No data found for SW_arable.