Field Notes

<--2018-07-17 12:20:00 | 2018-07-26 14:45:00-->

Sherman Barn: 2018-07-25 09:00:00 (DOY 206)
Author: Alex Valach
Others: Kuno, Katrina, Kyle, Tyler ...

Summary: Soil sampling session

We arrived around 9-9.30am.

Tyler was already there with another Lab tech. We set up 3 transects and collected 5 samples of 3 depths each (0-15, 15-30, 30-60cm) per transect, as well as a soil profile from a 1m pit.

Conditions were sunny, warm, with a strong wind. The water table was around 80cm below the surface.

We left around 12.30pm, but Tyler stayed on.

1 photos found

Weeds under Sherman Barn radiometer that Dennis trimmed away.
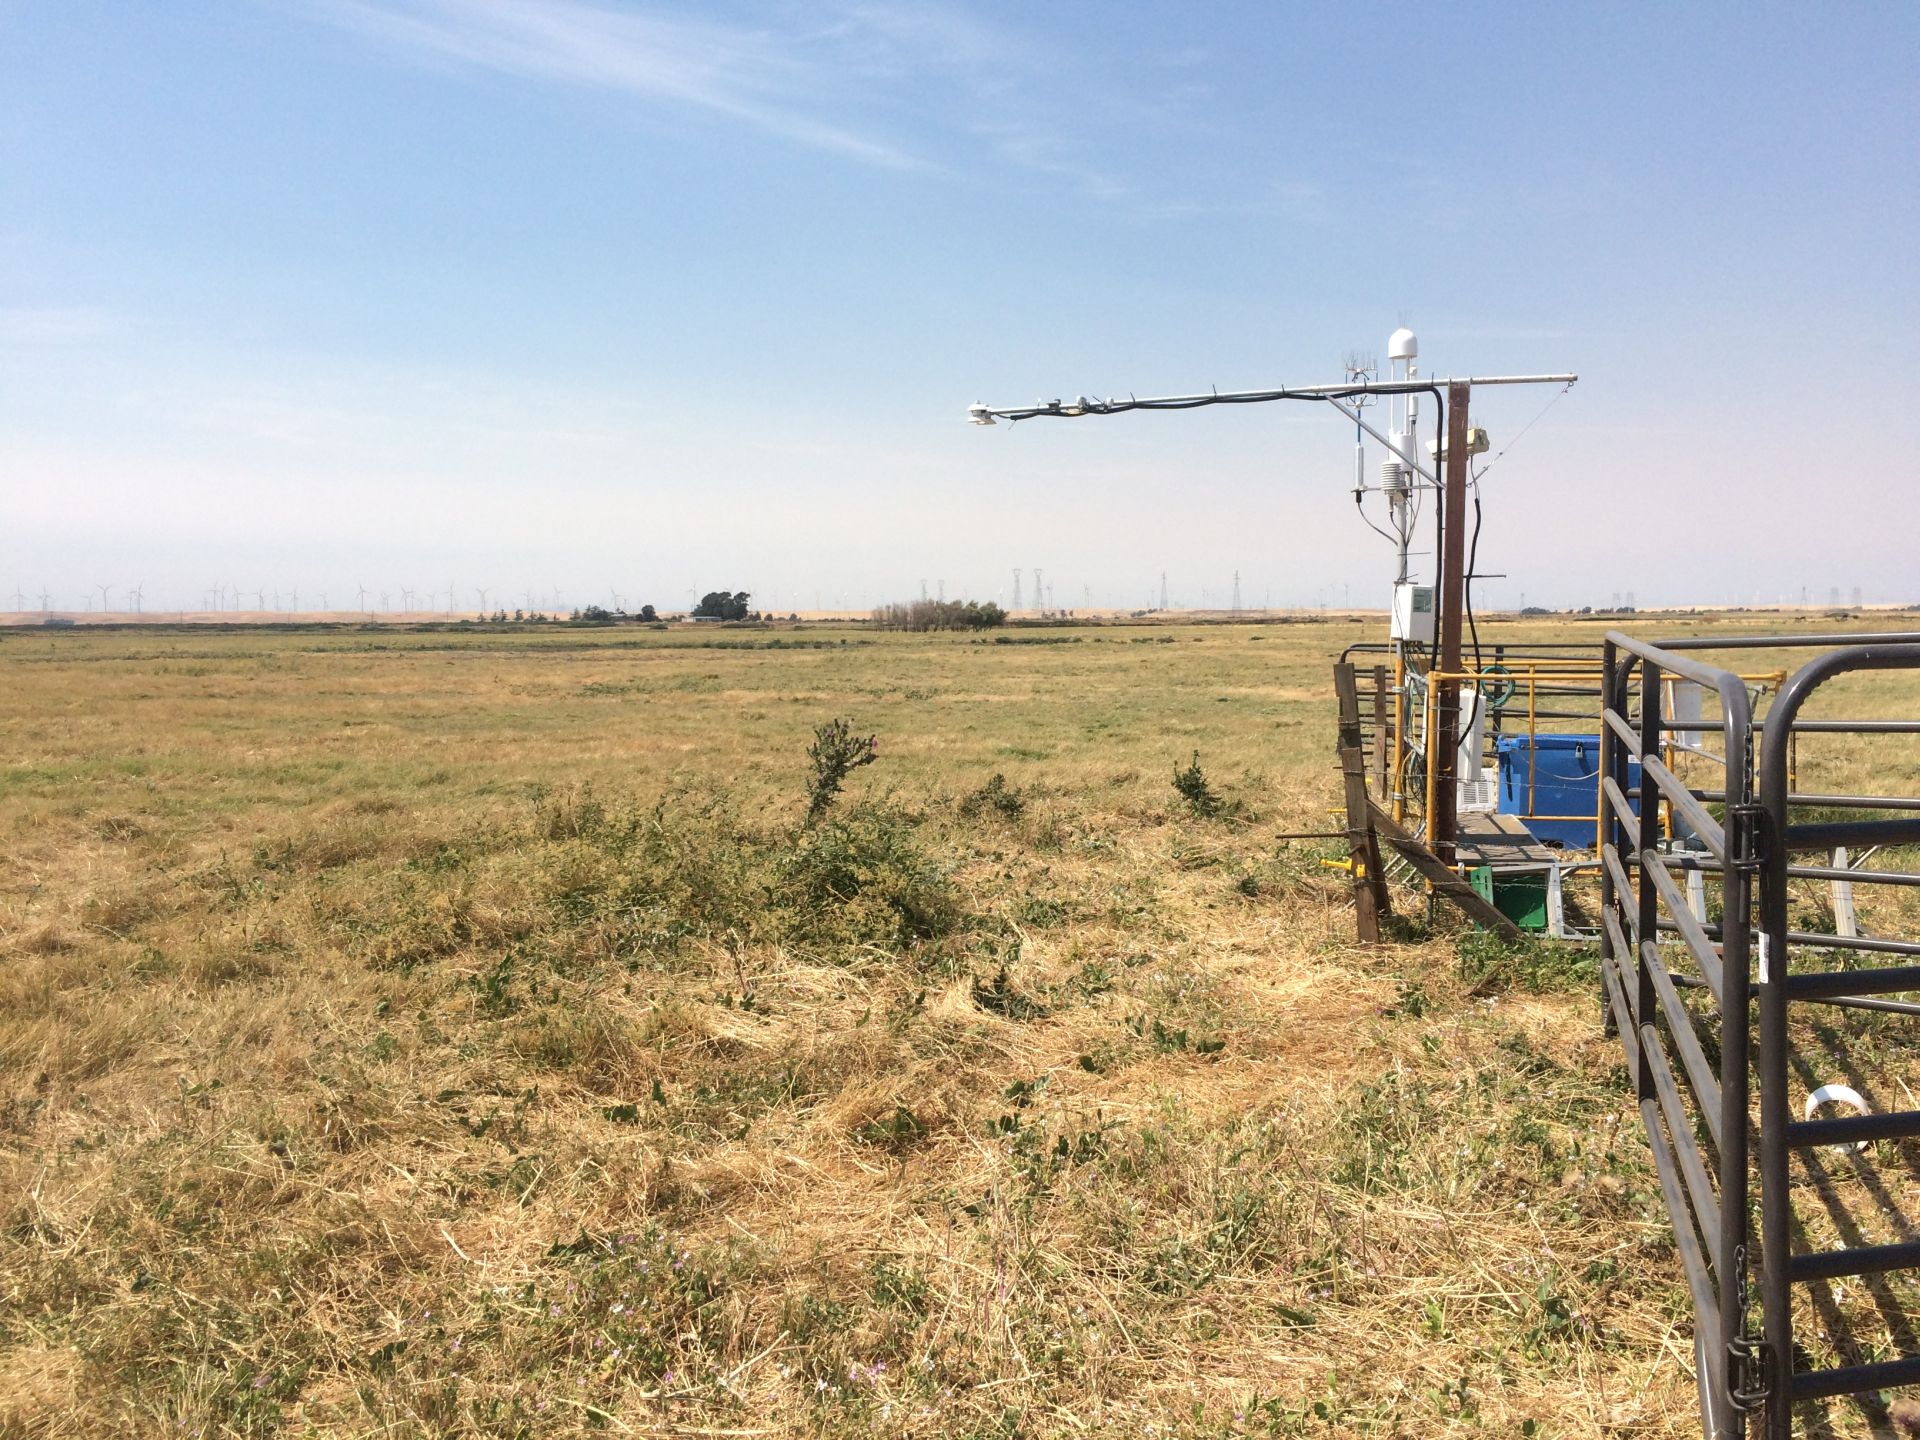
20180726SB_WeedsunderRadiometers.JPG ( 2018-07-26 14:56:43 ) Full size: 1920x1440
Weeds under Sherman Barn radiometer that Dennis trimmed away.

Graphs display:
3 sets found

4 SB_flux graphs found

Explore the graph:LI-7500 CO2 and H2O in a new window

Explore the graph:Wind in a new window

Explore the graph:Counts in a new window

Explore the graph:LI7700 CH4 and RSSI in a new window

15 SB_met graphs found

Explore the graph:Soil Heat Flux in a new window

Explore the graph:Temperature in a new window

Explore the graph:Air Pressure and RH in a new window

Explore the graph:Soil Moisture in a new window

Explore the graph:PAR in a new window

Explore the graph:NDVI channels in a new window

Explore the graph:PRI channels in a new window

Explore the graph:Solar Radiation in a new window

Explore the graph:SRS NDVI and PRI in a new window

Explore the graph:Thermocouple Set A in a new window

Explore the graph:Thermocouple Set B in a new window

Explore the graph:Thermocouple Set C in a new window

Explore the graph:Battery Voltage in a new window

Explore the graph:Water Level in a new window

Explore the graph:Counts from Motion Sensor in a new window

Can't check TATWBABCSB_cam