
Field Notes
<--2018-04-05 11:20:00 | 2018-05-03 12:20:00-->Other sites visited today: Sherman Wetland | Mayberry | East Pond | Bouldin Corn | Bouldin Alfalfa | Twitchell Alfalfa | East End
Phenocam link: Searching...
West Pond: 2018-04-19 15:40:00 (DOY 109)
Author: Daphne Szutu
Others: Sam, Elke, Alex, Kyle, Sophie
Summary: Regular data collection/cleaning, swap 7500, Veg surveys with Sophie
| 2018-04-19 West Pond We arrived at 10:55. It was breezy, sunny, and clear. The water level is a bit higher than last time and the water sensors are submerged again. Elke, Kyle, Alex, and Sophie were doing veg surveys here when we arrived. I collected met, camera, and USB GHG data. Sam cleaned the rad and flux sensors. I refilled the wash reservoir; it was ½ empty. We swapped LI-7500A: sn 75H-2180 came down, sn 75H-2514 went up. LI-7500 readings (sn 2180 --> sn 2514) CO2 408ppm --> 410 H2O 410ppm --> 395 T 17.4C --> 18.8 P 101.9 kPa --> 101.8 SS 97 --> LI-7700 readings: CH4 1.9ppm RSSI 33 --> 67 after cleaning We left around 11:15. Kyle, Elke, Alex, and Sophie were finishing up veg surveys in West Pond while we were here. Veg surveys: We conducted allometric vegetation surveys following Sophie's protocol at West Pond and East End. At WP: For the first transect, we walked along the boardwalk starting in the South-Eastern corner (South of the EC tower) and took measurements every 10m for 100m. For the second transect, we started on the boardwalk right next to the EC tower (North-Eastern corner) and took measurements every 10m again, but only for 60m. At that point the vegetation got too dense and we were not able to go any further. |
1 photos found
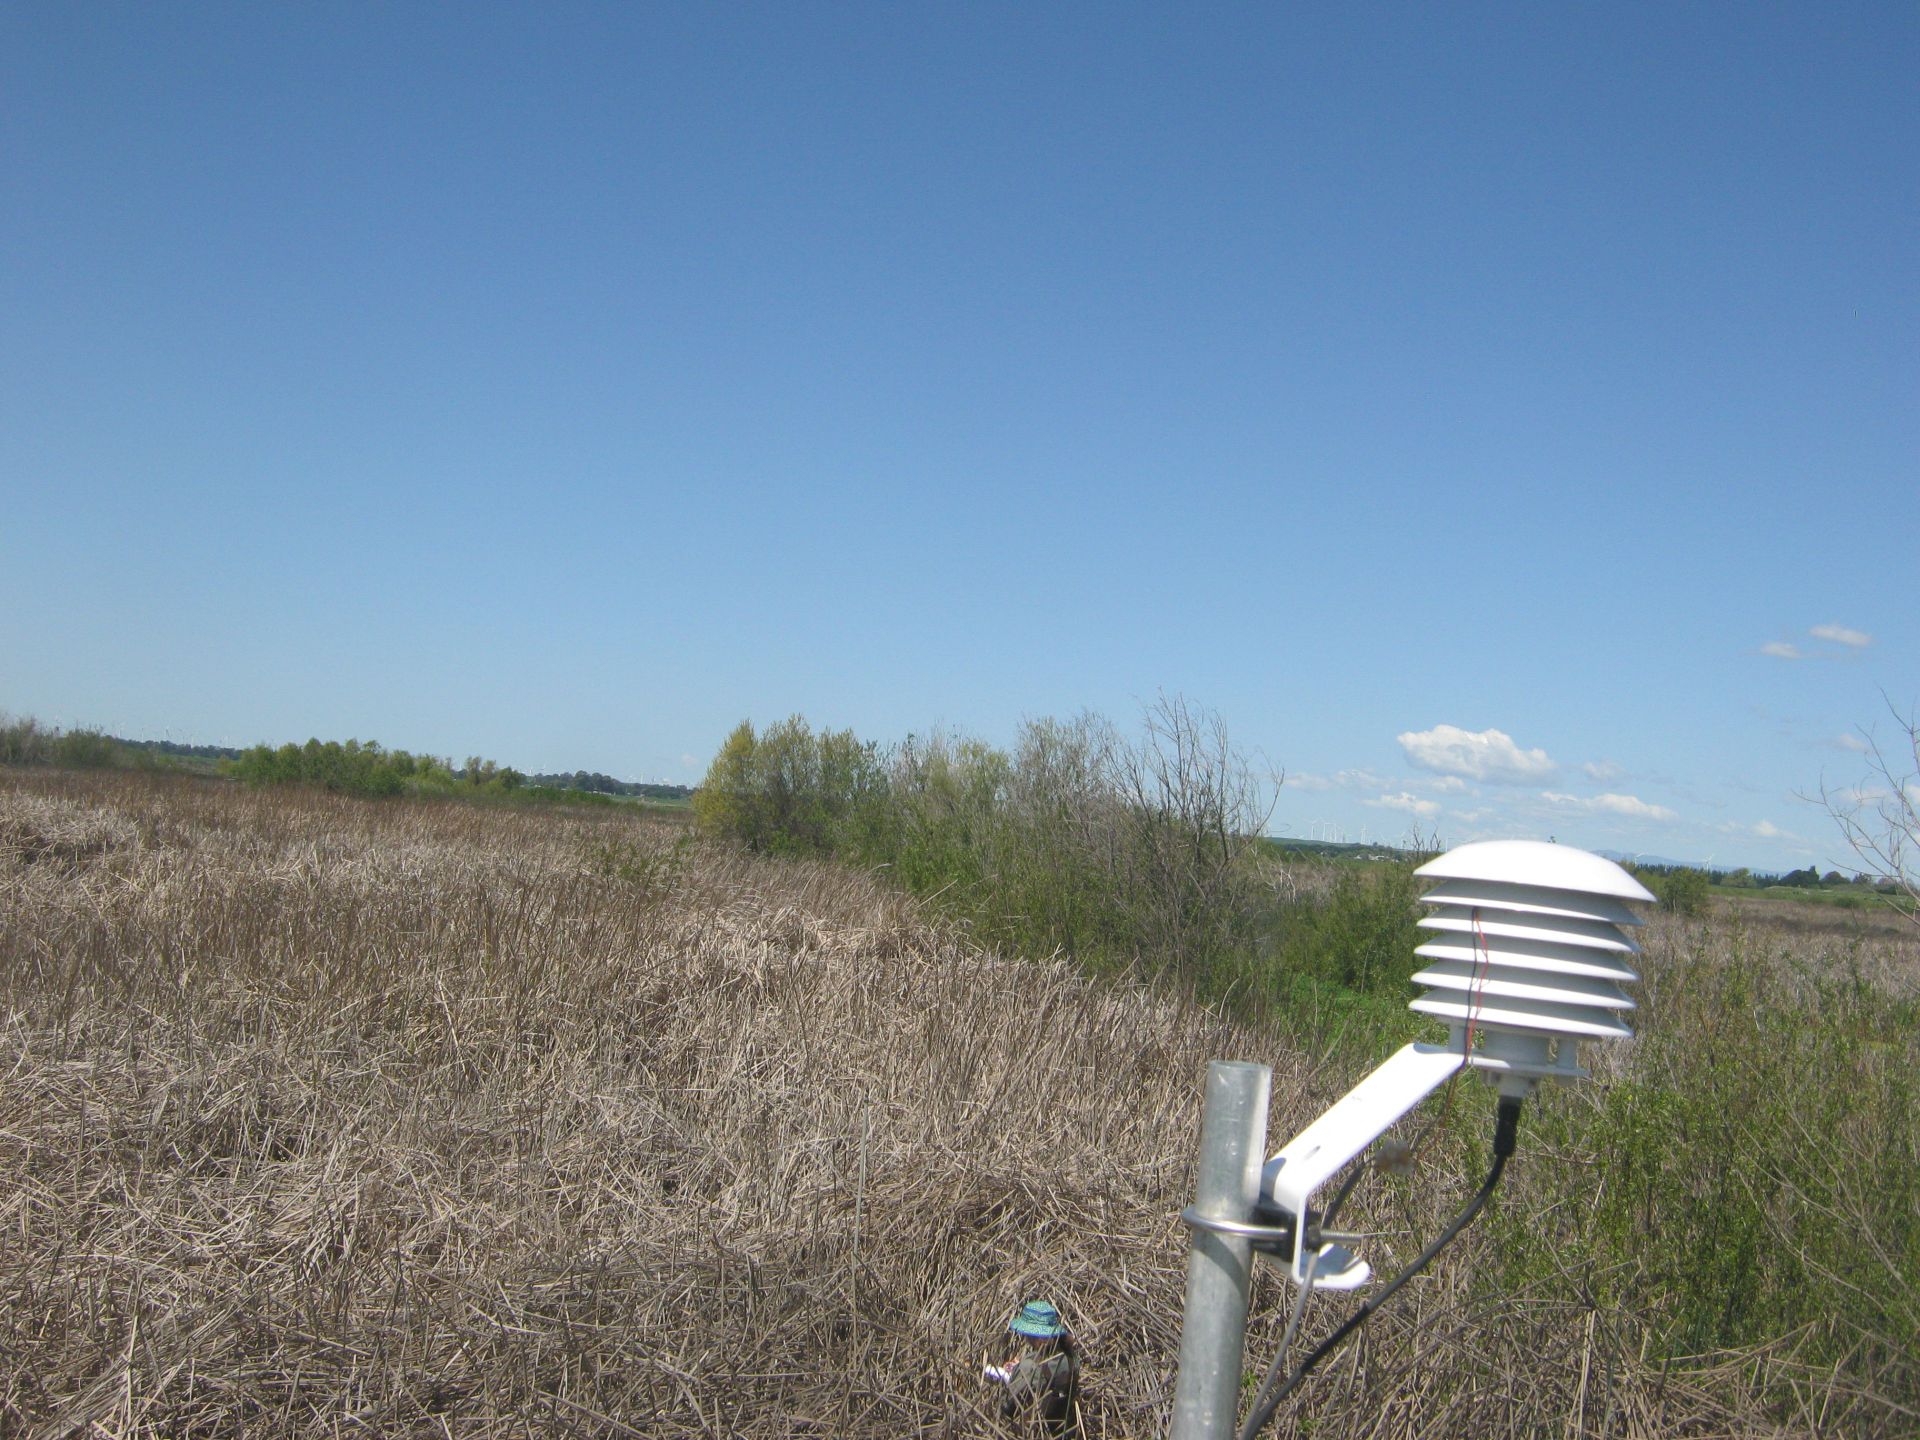
WP_autocam_20180419_1045.jpg ( 2018-04-19 10:45:02 ) Full size: 1920x1440
Elke doing leaf-level measurements
8 sets found
Can't check WP_DO
1 WP_DO graphs found
14 WP_met graphs found
5 WP_flux graphs found
Can't check MBWPEESWGT_mixed
Can't check MBEEWPSWEPGT_cam
Can't check MBSWEEWPBCBA
1 WP_processed graphs found
No data found for WP_arable.