Field Notes
<--2016-04-13 12:30:00 | 2016-05-12 10:45:00-->Other sites visited today: Twitchell Alfalfa | West Pond | Twitchell Rice | Mayberry
Phenocam link: Searching...
East End: 2016-04-28 11:30:00 (DOY 119)
Author: Elke Eichelmann
Others: Dennis Baldocchi, Kyle Hemes
Summary: Standard data collection, water level very low, took spectral measurements.
| Arrived at 11:30. Sunny, clear, windy day. The water level looks really low. In some of the higher elevation spots to the south of the tower the soil is above the water level. Some of our water sensors are just barely submerged: the top CO2 probe is sticking out of the water, but the sensing part of it is still submerged, and the DO probe looks like it is out of the water completely (not sure if it is DO, could be another probe). Filled LI7700 wash water reservoir, was still pretty full. Cleaned the sensors. Collected USB GHG data, collected met data from CR1000, collected camera card pictures. All looks good except SHF2 is not working (NaN). Took some spectral readings from boardwalk north of the tower. 5 to 6 readings walking in facing south and 5 to 6 readings walking back out facing north. Took one reference reading at the start, one at the end of the boardwalk (after 5 to 6 samples), and one at the end. First set some measurements were not written to the card since the card was not pushed in, so had to do it again. LI7500 readings: CO2 405.34 H2O 457.4 SS 100.56 T 22.55 P 101.12 LI7700 readings: CH4: 1.93 RSSI: really noisy at first, bouncing between 55 and 14 -> 83.4 after cleaning Left at 12:15 |
1 photos found

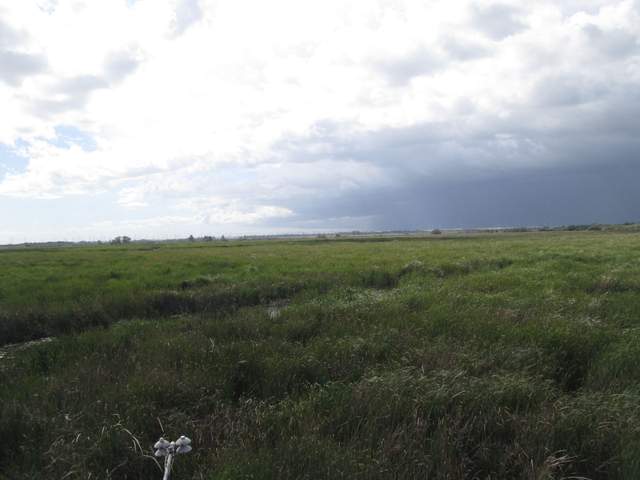
EE_autocam_20160427_1445.jpg ( 2016-04-27 14:45:00 ) Full size: 1920x1440
Rain coming
11 sets found
14 EE_met graphs found
Can't check EE_mixed
1 EE_mixed graphs found
8 EE_flux graphs found
Can't check MBWPEESWGT_mixed
1 EE_cam graphs found
Can't check MBEEWPSWEPGT_cam
Can't check SIMBTWEE_met
Can't check EE_Temp
5 EE_Temp graphs found
Can't check EE_minidot
1 EE_minidot graphs found
Can't check MBSWEEWPBCBA
1 EE_processed graphs found

