Field Notes
<--2016-03-29 11:10:00 | 2016-04-28 11:30:00-->Other sites visited today: Twitchell Alfalfa | West Pond | Twitchell Rice | Mayberry
Phenocam link: Searching...
East End: 2016-04-13 12:30:00 (DOY 104)
Author: Elke Eichelmann
Others: Joe Verfaillie
Summary: Calibrated LI7700, no GHG data recorded over past two weeks
| Arrived at 12:30. Sunny, clear, breezy with gusts. Cattails are green and tall, the water level looks low, there is a fine dust on the sensors, not clear what that is. LI7500 readings (units: umol/mol; mmol/m3; Celsius; kPa; %; m/s) CO2 408.62 -> 415.52 after cleaning H2O 493.5 T 19.62 P 102.06 SS 100.198 -> 102.019 after cleaning SOS 343.63 LI7700 readings (ppm, %): CH4: 2.03 -> 1.93 after cleaning RSSI: 28.7 -> 86.9 after cleaning The LED for the USB drive was not blinking, did not seem to collect data when we arrived, checked the USB drive and found that no GHG data was collected over the past two weeks since the last field visit. When inserting the new USB drive it did not seem to collect data either (LED not blinking, error message in LI7550 software), reset the LI7550 box, this seemed to do the trick. LED was blinking and LI7550 software reported data logging. Important to check if the LED comes on every time the USB drive is changed! Collected camera pictures, and Met data, all data looks good. Updated LI7550 sn AIU-0397 box firmware from v7.3.0 to v8.0.0 Refilled LI7700 wash water reservoir. Fixed broken wire leading to fan for HMP60 probe. Calibrated LI7700 sn TG1-0155. Calibration was done using zero air and the Ameriflux AMPCO2CH4-calibration gas at 1.9966ppm We left again at 13:30. |
1 photos found

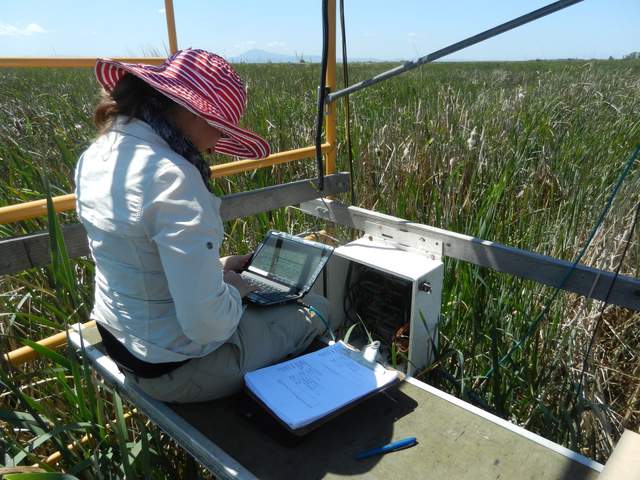
20160413EE_Elke_tn.jpg ( 2016-04-13 13:01:11 ) Full size: 1920x1440
Elke on site
11 sets found
14 EE_met graphs found
Can't check EE_mixed
1 EE_mixed graphs found
8 EE_flux graphs found
Can't check MBWPEESWGT_mixed
1 EE_cam graphs found
Can't check MBEEWPSWEPGT_cam
Can't check SIMBTWEE_met
Can't check EE_Temp
5 EE_Temp graphs found
Can't check EE_minidot
1 EE_minidot graphs found
Can't check MBSWEEWPBCBA
1 EE_processed graphs found

